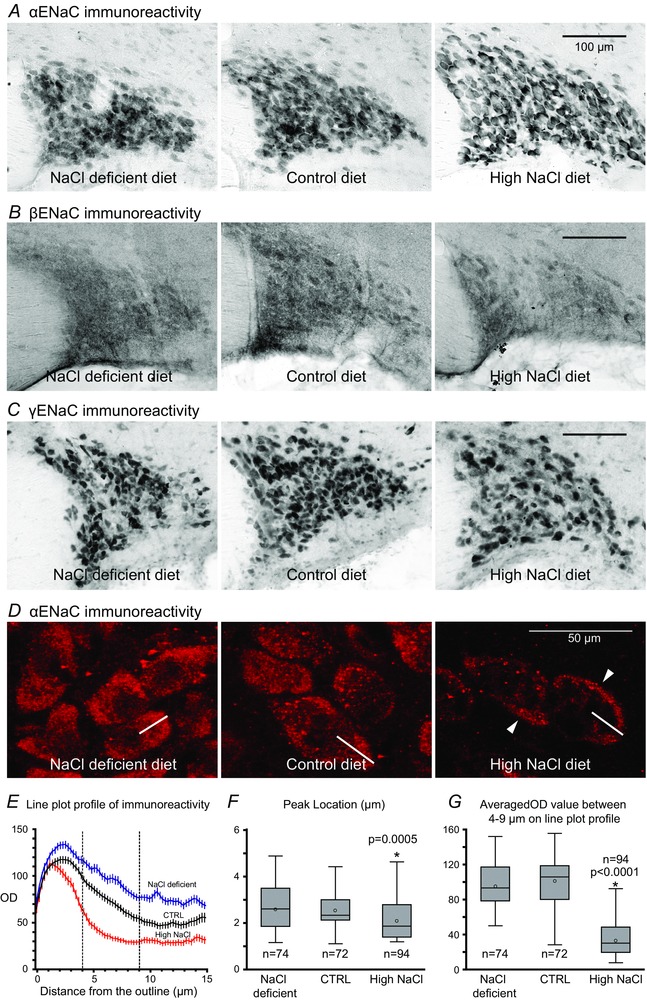
Figure 2. Photomicrographs showing immunoreactivity to αENaC (A), βENaC (B), and γENaC (C) in the SON from rats that were fed NaCl deficient, control, or a high NaCl diet.

A, strong αENaC immunoreactivity was found in MNCs regardless of dietary NaCl intake level; however, the immunoreactivity in MNCs from the NaCl deficient and control diet groups was diffused overall, whereas that in MNCs from the high NaCl group was sharper and outlined the soma more clearly. The difference in overall appearance of immunoreactivity appears to come from difference in the subcellular distribution of the immunoreactivity. B, only moderate and dispersed βENaC immunoreactivity was found in MNCs in the SON. There was no apparent difference in intensity or appearance of βENaC immunoreactivity in the SON among different dietary salt intakes. C, robust immunoreactivity was found in a limited number of MNCs in which immunoreactive product completely filled the soma regardless of the dietary NaCl. There were also many weakly labelled MNCs among strongly labelled MNCs. D, confocal microscopy of αENaC immunoreactivities in MNCs in the SON from rats fed NaCl deficient, control, and high NaCl diet. The αENaC immunolabelling in MNCs of NaCl deficient and control groups are mainly dispersed in the cytoplasm. Labelling in MNCs from the high NaCl diet group is concentrated towards the plasma membrane (arrows). 1 μm optical section. The white line in each image represents an example of the plot reference line where the profile of the optical density of immunoreactivity over the distance from the beginning (the outline of neuron) of the line was obtained. E, the averaged plot line profile of the optical density (OD) of immunoreactivity from the NaCl deficient (blue), control (black), and high NaCl diet (red) groups. Error bars represent SEM. F, the location of the peak OD value on the line plot profile. The peak OD value occurred significantly closer to the outline of each neuron from the high NaCl group than to those from the NaCl deficient or control groups. G, averaged OD values between 4 and 9 μm (indicated by vertical dashed lines in E) on the line plots profile. The mean averaged OD value of the high NaCl group was significantly lower than that of either the NaCl deficient or control groups.
