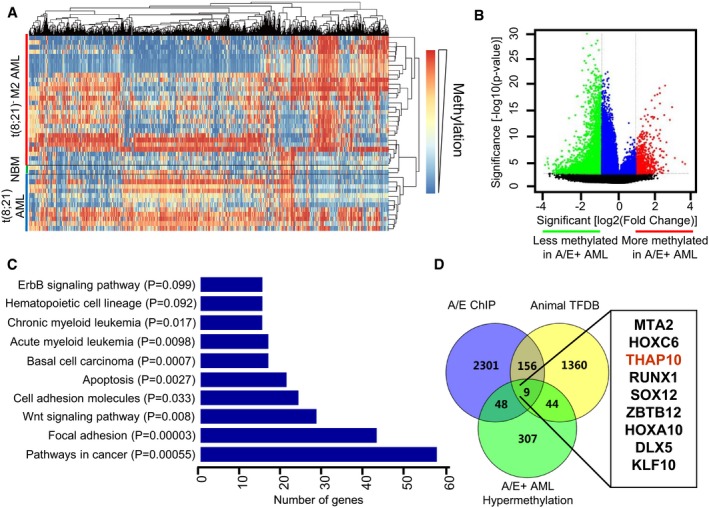
Overview of two‐way (genes against samples) hierarchical clustering of AML1‐ETO+ (n = 12), AML1‐ETO− (n = 28) M2 AML blasts and normal bone marrow cells (NBM, n = 2) using the genes that vary the most among samples. Representative heatmap is shown to identify the aberrant DNA methylation signatures of specific genes in AML, compared to normal CD34+ haematopoietic cells obtained from healthy donors. In this heatmap, each column represents one gene, and each row represents one AML patient or healthy donor. Red bar, t(8;21)− M2 AML. Blue bar, t(8;21)+ AML. Green bar, normal bone marrow (NBM).
Volcano plot illustrating the methylation difference between AML1‐ETO+ (n = 12) and AML1‐ETO− (n = 28) AML samples, with the corresponding moderated t‐test P‐values. Red, probe sets that were significantly hypermethylated (P < 0.001, methylation difference > 1.5); green, probe sets that were significantly hypomethylated (P < 0.001, methylation difference < −1.5); blue, probe sets that did not have an absolute methylation difference > 1.5.
Functional enrichment analysis of differential DNA methylation genes (DMGs), based on the pathway enrichment analysis of hypergeometric distribution.
Venn diagrams for systematic survey of the publicly available database, by combining with 408 differentially methylated genes identified in the present study (see panel B), to identify the 9‐gene set in t(8;21) AML.
Data information: All experiments were performed in triplicate.

