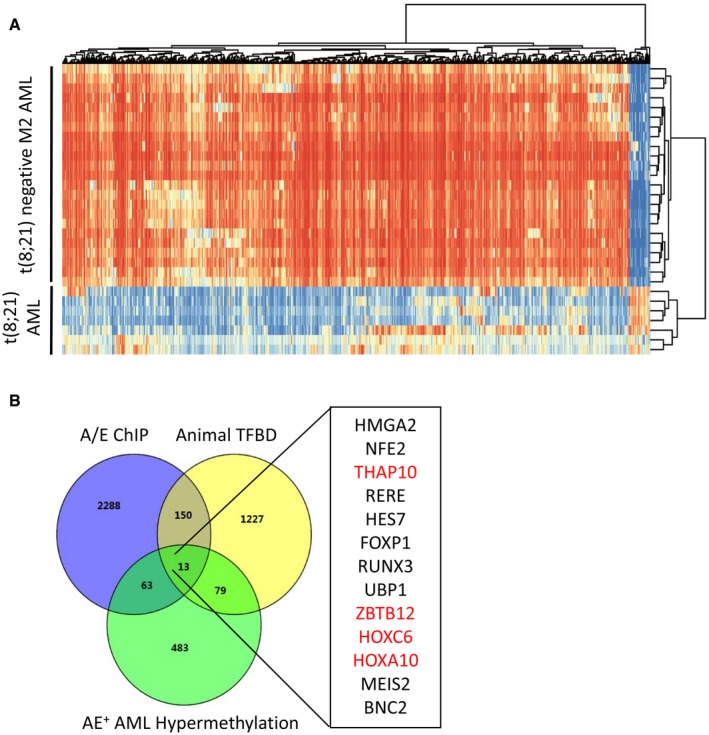
Figure EV1. TCGA methylome database reanalysis showed that AML1‐ETO + AML displays a similar unique genome‐wide methylation signature compared to our data.

- Overview of two‐way (genes against samples) hierarchical clustering of AML1‐ETO+ (n = 7) and AML1‐ETO− (n = 37) M2 AML blasts using the genes that vary the most among samples. Representative heatmap is shown to identify the aberrant DNA methylation signatures of specific genes in AML. Each column of the heatmap represents one gene, and each row represents one AML patient.
- Venn diagrams for systematic survey of the publicly available database to identify the 13 genes in t(8;21) AML. Four out of 13 genes overlapped with our distinct signature in t(8;21) AML and are shown in red, including THAP10.
Source data are available online for this figure.
