-
A
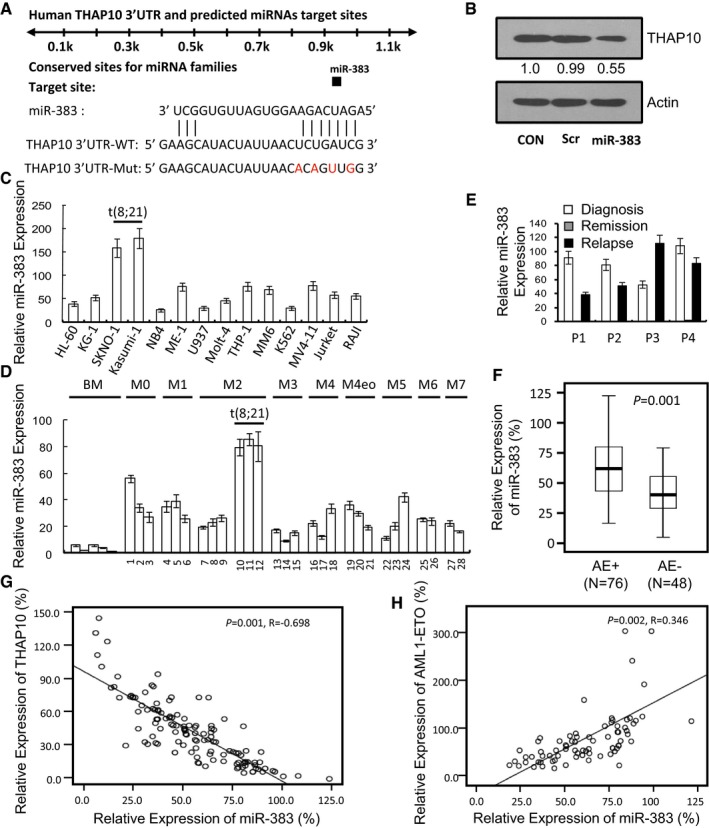
The sequences indicating the putative interaction site between the miR‐383 seed region (nucleotides 2–8) and the 3′‐UTRs of THAP10 wild‐type (WT) or mutated derivatives.
-
B
Western blot analysis monitoring the effect of synthetic miR‐383 on THAP10 protein levels.
-
C, D
Relative qRT–PCR quantification of THAP10 mRNA levels in the indicated leukaemia cell lines (C) and mononuclear cells (MNC) isolated from leukaemia patients (D) (n = 28). Triplicate values are defined as mean ± SD.
-
E
Sequential analyses of miR‐383 levels in mononuclear cells isolated from bone marrow samples of four individual leukaemia patients at the newly diagnosed, remission and relapse stages, respectively. Triplicate values are defined as mean ± SD.
-
F
Relative qRT–PCR quantification of THAP10 mRNA levels in two groups of AML M2 subtype patients (total n = 124): AML1‐ETO+ and AML1‐ETO− t(8;21) AML (P = 0.001). Data are represented as a boxplot, which shows the median value of mRNA levels (line in the middle of the box), the first and third quartiles (lower and upper limits of each box, respectively). Whiskers display the highest and lowest data values.
-
G, H
Correlation of miR‐383 expression with THAP10 (R = −0.689, P = 0.001, G) or AML1‐ETO levels (R = 0.346, P = 0.002, H). Two‐sided paired Pearson test was used for the significance of association.
Data information: All experiments were performed in triplicate.

