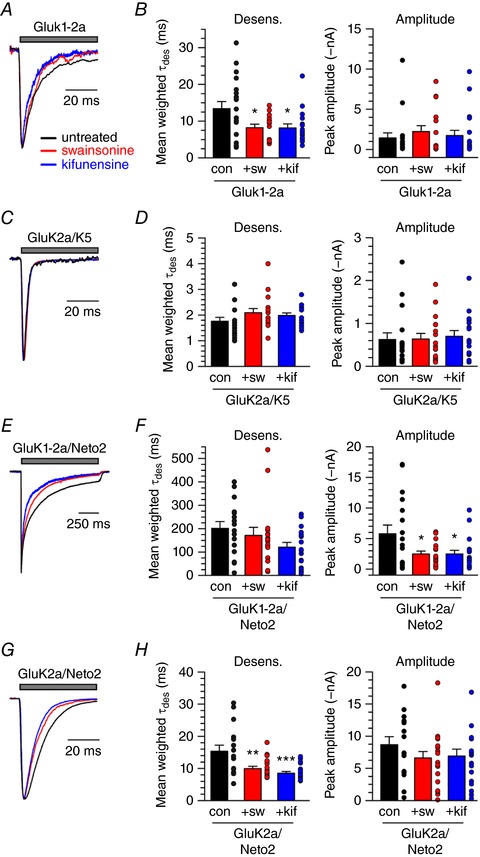
Figure 3. α‐mannosidase inhibition speeds up the desensitization of other KAR combinations.

A, representative current traces from untreated control, swainsonine‐treated and kifunensine‐treated HEK293T/17 cells expressing myc‐GluK1‐2a. Grey bar indicates glutamate (10 mm) application. Amplitudes are scaled. B, quantification of glutamate‐evoked desensitization and amplitude from untreated and treated HEK293T/17 cells expressing myc‐GluK1‐2a. C and D, as in (A) and (B). Cells express myc‐GluK2a and myc‐GluK5. E and F, as in (A) and (B). Cells express myc‐GluK1‐2a and Neto2. G and H, as in (A) and (B). Cells express myc‐GluK2a and Neto2. Error bars indicate the SEM. con, control; sw, swainsonine treatment; kif, kifunensine treatment. Statistical significance is indicated: * P < 0.05, ** P < 0.01, *** P < 0.001. [Color figure can be viewed at wileyonlinelibrary.com]
