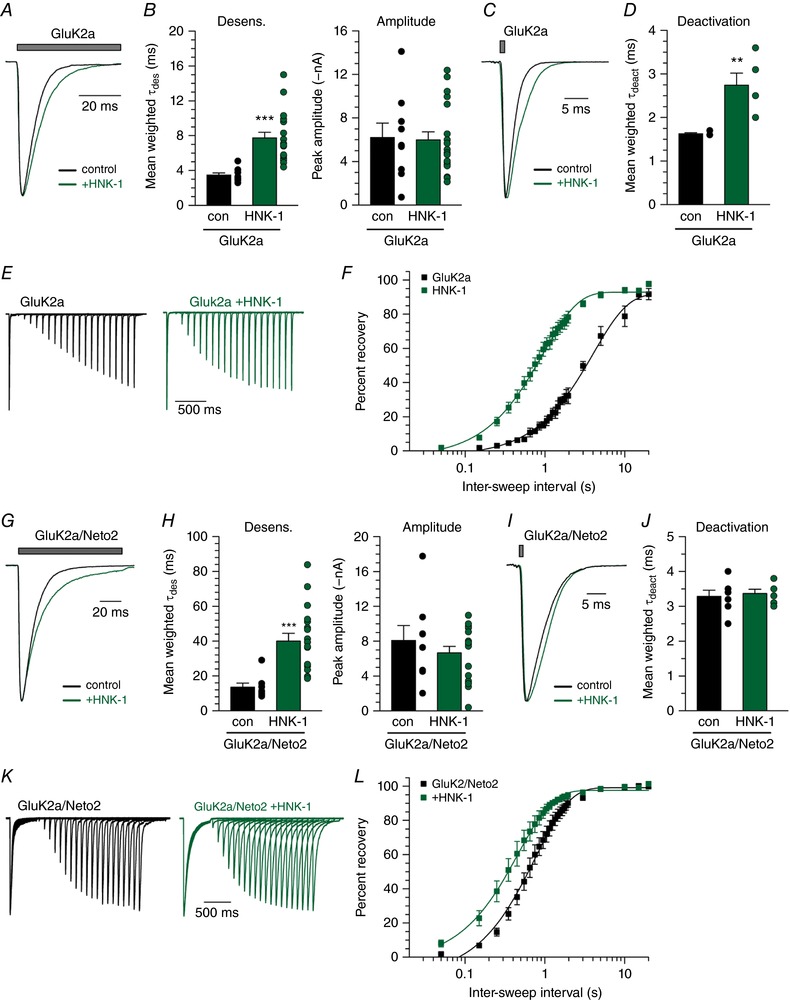
Figure 5. HNK‐1 conjugation alters desensitization and deactivation of GluK2a‐containing receptors.

A, representative current traces from control HEK293T/17 cells expressing only myc‐GluK2a and from cells where myc‐GluK2a was co‐expressed with the HNK‐1‐conjugating transferases GlcAT‐P and HNK‐1ST. Grey bar indicates glutamate (10 mm) application. Amplitudes are scaled. B, quantification of glutamate‐evoked desensitization and amplitude from myc‐GluK2a alone and HNK‐1 co‐expressing HEK293T/17 cells. C, representative GluK2a deactivation current traces with and without HNK‐1. Grey bar indicates glutamate (10 mm) application. Amplitudes are scaled. D, quantification of glutamate‐evoked deactivation from myc‐GluK2a‐containing outside‐out patches pulled from control and HNK‐1 co‐transfected HEK293T/17 cells. E, representative current traces in two‐pulse glutamate (10 mm) recovery experiments recorded from myc‐GluK2a expressing HEK293T/17 cells transfected either alone or with HNK‐1‐conjugating transferases. Intervals between glutamate exposures range from 50 ms to 2 s in the traces shown. Amplitudes from the first glutamate application are scaled. F, quantification of mean glutamate recovery for myc‐GluK2a‐expressing cells with and without HNK‐1 conjugation. Amplitude of the second glutamate application in a two‐pulse experiment is reported as a normalized percentage of the first glutamate application. Results were fitted with a single component exponential equation and the best‐fit τrec values differ significantly (P < 0.0001). G, representative current traces from control HEK293T/17 cells expressing myc‐GluK2a and Neto2 alone or with HNK‐1 transferases. Grey bar indicates glutamate (10 mm) application. Amplitudes are scaled. H, quantification of glutamate‐evoked desensitization and amplitude from myc‐GluK2a/Neto2 alone and HNK‐1 co‐expressing HEK293T/17 cells. I, representative GluK2a/Neto2 deactivation current traces with and without HNK‐1. Grey bar indicates glutamate (10 mm) application. Amplitudes are scaled. J, quantification of glutamate‐evoked deactivation from myc‐GluK2a/Neto2‐containing outside‐out patches pulled from control and HNK‐1 co‐transfected HEK293T/17 cells. K, representative current traces in two‐pulse glutamate (10 mm) recovery experiments recorded from myc‐GluK2a/Neto2 expressing HEK293T/17 cells transfected either alone or with HNK‐1‐conjugating transferases. As in (E). L, quantification of mean glutamate recovery for myc‐GluK2a/Neto2‐expressing cells with and without HNK‐1 conjugation, as in (F). Results were fitted with a single component exponential equation and the best‐fit τrec values differ significantly (P < 0.0001). con, control transfection of receptor alone; HNK‐1, co‐transfection with GlucAT‐P and HNK‐1ST. Error bars indicate the SEM. Statistical significance is indicated: ** P < 0.01, *** P < 0.001. [Color figure can be viewed at wileyonlinelibrary.com]
