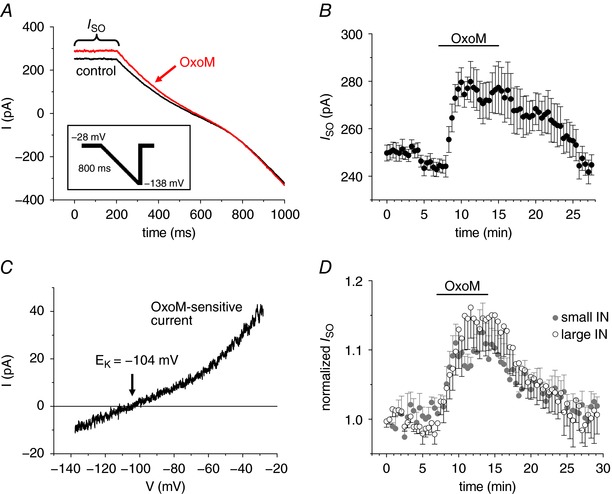
Figure 2. MAChR stimulation increases the standing outward current (I SO) in INs.

A, representative current traces induced by hyperpolarizing voltage ramps (see inset) under control conditions (black trace) and in the presence of OxoM (10 μm; red trace). The inset shows the applied voltage clamp protocol. B, mean values of I SO vs. time plot indicating a reversible increase in I SO (n = 10). C, exemplar current–voltage (I–V) relationship of the OxoM‐sensitive current that was obtained by subtracting control current traces from traces during drug application and assigning each point in time to the corresponding membrane potential. D, normalized mean values of I SO vs. time plots in dLGN INs categorized as small (grey circles, n = 7) or large (open circles, n = 7) as previously described (Leist et al. 2016).
