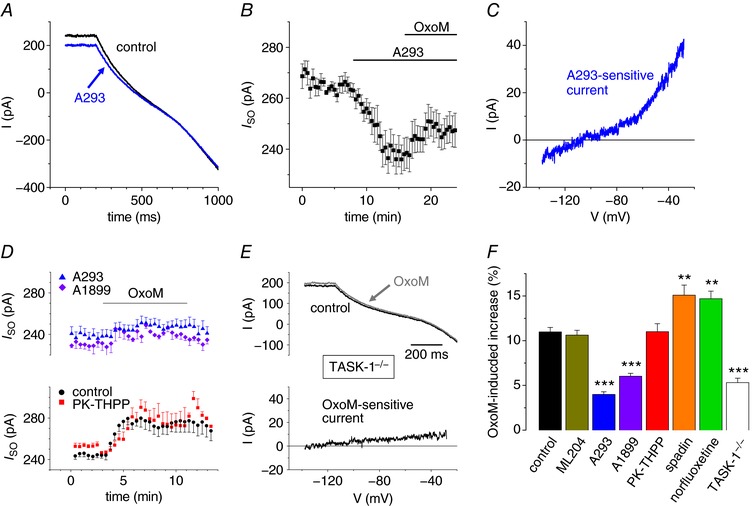
Figure 3. TASK‐1 channel blockers reduce the OxoM‐mediated increase in I SO .

A, representative current traces induced by hyperpolarizing voltage ramps under control conditions (black trace) and in the presence of A293 (5 μm; blue trace). B, mean I SO vs. time plot illustrating current reduction during application of A293 followed by a small current increase when OxoM was applied (n = 8). C, a representative I–V relationship of the A293‐sensitive current. D, I SO vs. time plots of the OxoM‐mediated modulation of I SO in the presence of different TASK channel blockers. Note that the TASK‐3 channel blocker PK‐THPP (red squares, n = 8) does not significantly alter the OxoM response seen under control conditions (black circles; as in Fig. 2 B), whereas the TASK‐1 channel blockers A1899 (purple diamonds, n = 6) and A293 (blue triangles, as in Fig. 3 B) reduced the OxoM effect. E, representative current traces (upper panel) induced by hyperpolarizing voltage ramps (control conditions, black trace; OxoM, 10 μm, grey trace) and the OxoM‐sensitive current component (lower panel) recorded in TASK‐1‐deficient mice. F, summary bar graph illustrating the mean I SO change during the application of OxoM under control conditions (black bar), TASK‐1‐deficient mice (white bar) and in the presence of different ion channel blockers as indicated. Black stars indicate significance levels obtained by the use of ANOVA testing with respective controls.
