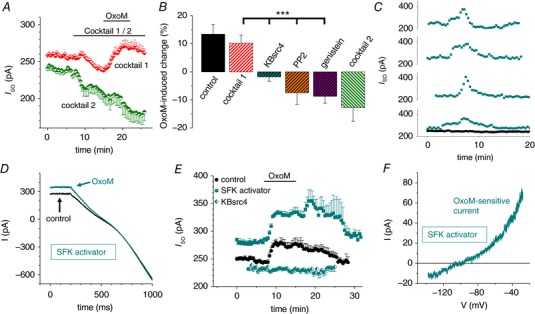
Figure 4. I SO modulation via M2/4AChR requires non‐receptor c‐Src tyrosine kinase activity.

A, mean I SO vs. time plot illustrating the OxoM‐mediated current modulation in the presence of M2/4AChR‐ (cocktail 2, green symbols, n = 8) and M1/3AChR‐specific blockers (cocktail 1, red symbols, n = 10). Note that M2/4AChR stimulation is required for the OxoM‐mediated increase in I SO. B, summary bar graph of the maximal I SO change during the application of OxoM alone (black control bar) and in combination with different muscarinic receptor antagonist cocktails as indicated. Inhibitors of non‐receptor SFKs were applied in the presence of cocktail 1 (i.e. blocking M1/3AChR; shown by hatched bars) as indicated. C, I SO vs. time plots illustrating a considerably current increase, which appears spontaneously in some INs following intracellular application of the SFK activator (turquoise squares; t = 0 corresponds to a time point of about 5 min after establishing the whole cell configuration). Drug free control measurements of the I SO (black squares, n = 7) were stable (mean: 0.995 ± 0.015) over time. D, representative current traces induced by hyperpolarizing voltage ramps in the presence of the SFK activator (control, black trace) and following additional application of OxoM (turquoise trace). E, mean I SO vs. time plot with the SFK activator peptide applied via the recording pipette (turquoise squares, n = 10). I SO modulation during OxoM application was markedly increased (P MW = 0.037) compared to control (black circles, as in Fig. 2 B). No current modulation was found in the presence of the selective c‐Src TK inhibitor KBsrc4 (half turquoise symbols). F, exemplar I–V relationship of the OxoM‐sensitive current in the presence of the SFK activator.
