
Figure 5. Characterization of the signalling pathway underlying the increase of I SO in dLGN INs.
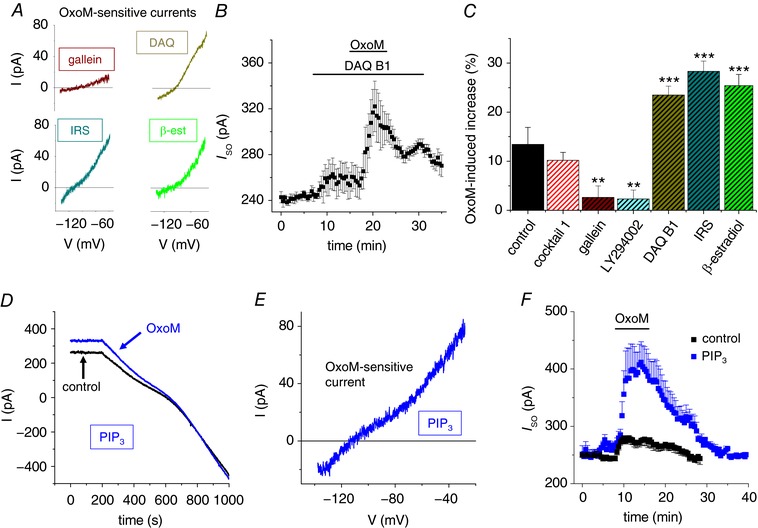
A, I–V relationships of the OxoM‐sensitive currents in the presence of different drugs (as indicated; DAQ, DAQ B1; IRS, IRS‐1‐Y608P; β‐est, β‐estradiol). B, mean I SO vs. time plot illustrating the strongly enhanced I SO increase in the presence of DAQ B1 (n = 8). C, summary bar graph illustrating the maximal I SO change during the application of OxoM. Hatched bars indicate that M1/3AChR antagonists were present during the application of OxoM. D, examplar traces of voltage clamp recordings in the absence (black trace) and in the presence of OxoM (blue trace) when 50 μm PIP3 was added to the pipette solution. E, exemplar I–V relationship of the OxoM‐sensitive current with PIP3 added to the pipette solution. F, mean I SO vs. time plot illustrating the strongly enhanced and prolonged I SO increase in experiments in which PIP3 was added to the pipette solution (blue symbols, n = 7) in comparison to the control effect (black symbols, as in Fig. 2 B). Note that muscarinic receptor stimulation is still required to cause a detectable change in I SO.