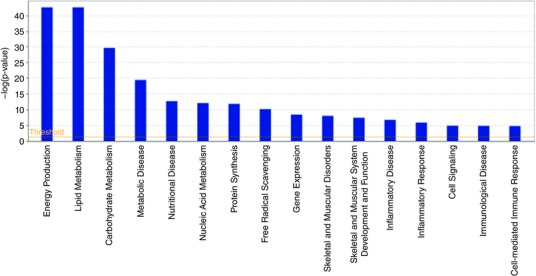
Figure 8. Cellular functions identified by IPA as being altered from control (n = 8) in soleus muscle of meldonium‐treated animals (n = 8) based on mRNA expression data generated using the low‐density microarray cards.

The x‐axis displays cellular functions most affected by meldonium administration, whereas the y‐axis displays the –log of the P value. The –log of the P value was calculated by Fisher's exact test right‐tailed (P < 0.05).
