
Figure 5. Increased number of nestin positive (Nes+) cells in VEGFf/f, but not VEGFHSA−/−, mice following two weeks of voluntary exercise training.
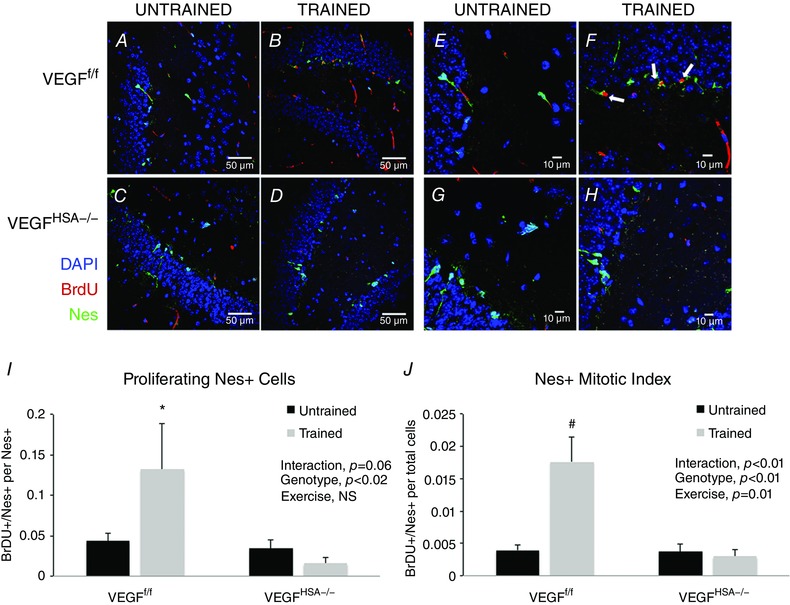
A–H, confocal images of the dentate gyrus sections revealing DAPI‐, BrdU‐ and Nestin‐positive cells. I, BrDU+/Nes+ cells per number of Nes+ cells. J, BrDU+/Nes+ cells per total DAPI‐labelled cells. Data are expressed as the mean ± SEM, n = 6–8. *Significant difference between VEGFf/f‐trained and VEGFHSA−/−‐trained, P < 0.05; #significant difference between VEGFf/f‐trained and the other three groups, P < 0.01. In A–D, scale bar = 50 μm; E–H, scale bar = 10 μm.