
Figure 2. Effect of exercise training on the lactate threshold test.
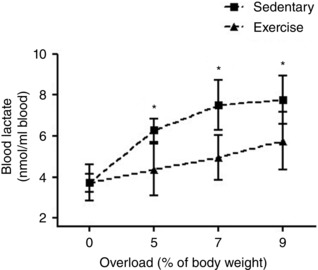
Data are expressed as the mean ± SEM for n = 6. * P < 0.05 compared to trained group (F test for simple effect).
Official websites use .gov
A
.gov website belongs to an official
government organization in the United States.
Secure .gov websites use HTTPS
A lock (
) or https:// means you've safely
connected to the .gov website. Share sensitive
information only on official, secure websites.
Data are expressed as the mean ± SEM for n = 6. * P < 0.05 compared to trained group (F test for simple effect).