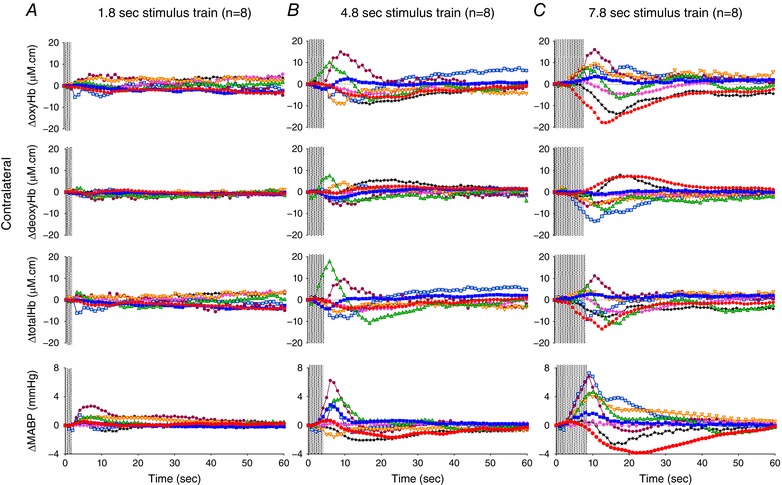
Figure 2. Changes in oxy‐, deoxy‐ and total haemoglobin (ΔoxyHb, ΔdeoxyHb and Δtotal Hb), recorded from the contralateral hemispheres, and mean arterial blood pressure (ΔMABP), following a 3.3 Hz stimulus train of 1.8 (A), 4.8 (B), or 7.8 s (C) duration.

Individual lambs are shown by different colours. Shaded area in each graph shows the period of stimulation. [Color figure can be viewed at wileyonlinelibrary.com]
