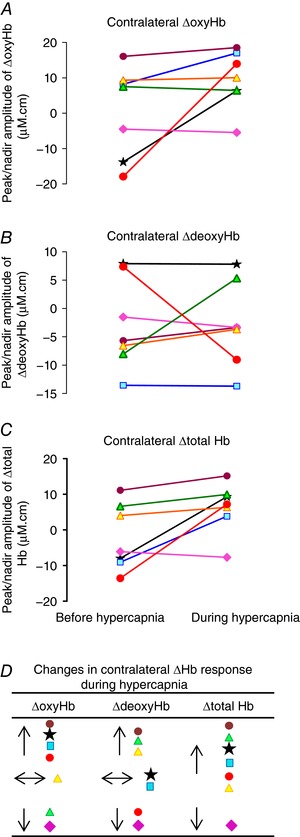
Figure 6. The peak changes in the oxyhaemoglobin (ΔoxyHb; A), deoxyhaemoglobin (ΔdeoxyHb; B) and total haemoglobin (Δtotal Hb; C) in the contralateral hemisphere for the positive response pattern, or the nadir changes for the negative response pattern, after the 7.8 s stimulus train before and during hypercapnia in 7 individual fetuses as shown by different colours.

Comparing the changes before vs. during hypercapnia, P = 0.11 for ΔoxyHb, 0.99 for ΔdeoxyHb and 0.04 for Δtotal Hb. D, compared to the functional response before hypercapnia, 6 of the 7 lambs (denoted by the same coloured symbols as in A–C) showed increase in the Δtotal Hb response during hypercapnia, of which 4 lambs had increase in the ΔoxyHb response, 1 had no change and 1 had reduction in the ΔoxyHb response, with variable ΔdeoxyHb changes. One lamb showed reduction in the ΔoxyHb, ΔdeoxyHb and Δtotal Hb response during hypercapnia. [Color figure can be viewed at wileyonlinelibrary.com]
