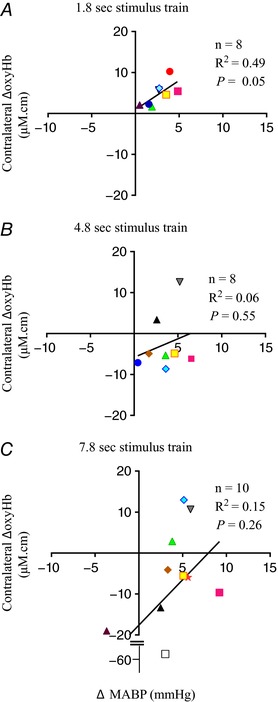
Figure 7. Data from fetal sheep obtained using the same experimental paradigm (Nakamura et al. 2017), correlating the peak changes in oxyhaemoglobin (ΔoxyHb) recorded from the contralateral hemisphere for the positive response pattern, or the nadir ΔoxyHb for the negative response pattern, with the mean arterial pressure (ΔMABP) following a 3.3 Hz stimulus train of 1.8 (A), 4.8 (B), or 7.8 s (C) duration.

No significant correlation was found between ΔoxyHb and ΔMABP with all 3 durations of stimulation. [Color figure can be viewed at wileyonlinelibrary.com]
