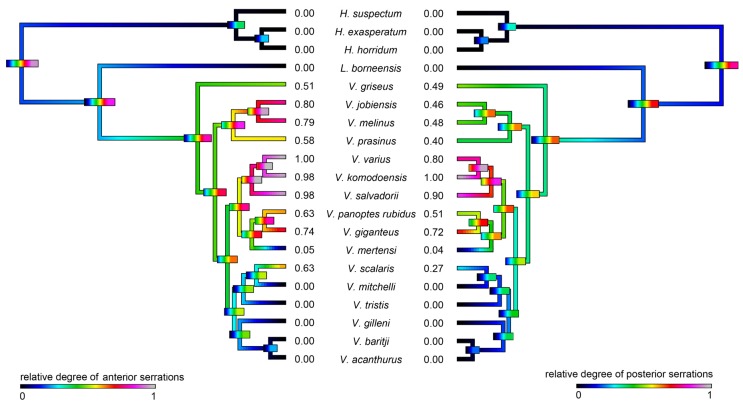
Figure 3.
Ancestral state reconstructions over branches for anterior teeth serrations and posterior teeth serrations inhibition where warmer colours represent more serrations. Bars indicate 95% confidence intervals for the estimate at each node. Note that due to the high dynamicity of venom evolution these quickly become broad as you move down the tree. Phylogeny follows [65,66,67].

