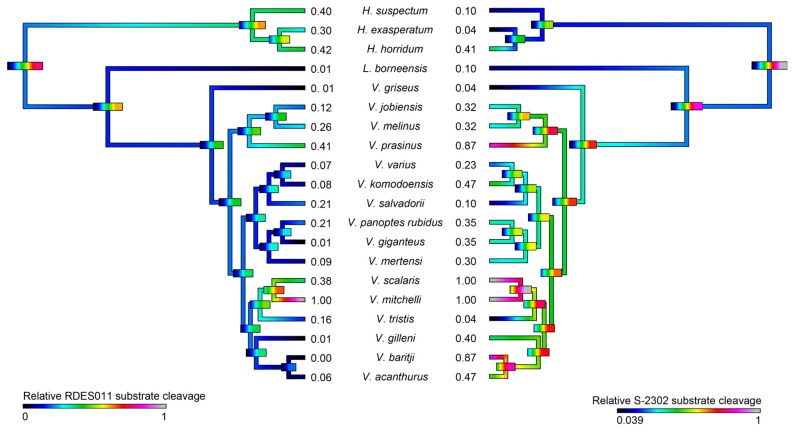
Figure 10.
Ancestral state reconstruction of serine protease substrate activity, where warmer colours represent more potent substrate cleavage. Bars indicate 95% confidence intervals for the estimate at each node. Note that due to the high dynamicity of venom evolution the ranges quickly become broad as one moves down the tree. Phylogeny follows [65,66,67].

