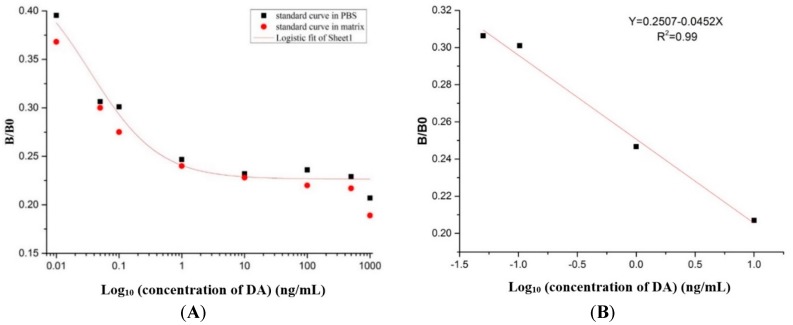
Figure 6.
Standard curves for DA detection. (A) Standard curve was obtained by plotting (B/B0) against DA concentration. The equation was y = 0.447/(1 + (x/0.0349)0.795), and the correlation coefficient (R2) was about 0.98; (B) The linear portion of standard curve. y = 0.2507 − 0.0452x with the correlation coefficient (R2) 0.99.

