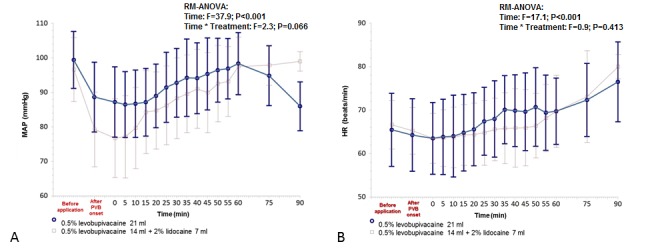
Figure 3.

The differences in the dynamics of (A) mean arterial pressure (MAP, mmHg) and (B) heart rate (HR, bpm) between the test groups and the times (minutes) of measurement according to the analysis of a variance for repeated measures (0 indicates the initial values measured by hemodynamic Vigileo / FloTrac system after performing a successful block). Error bars represent mean (95% confidence interval).
