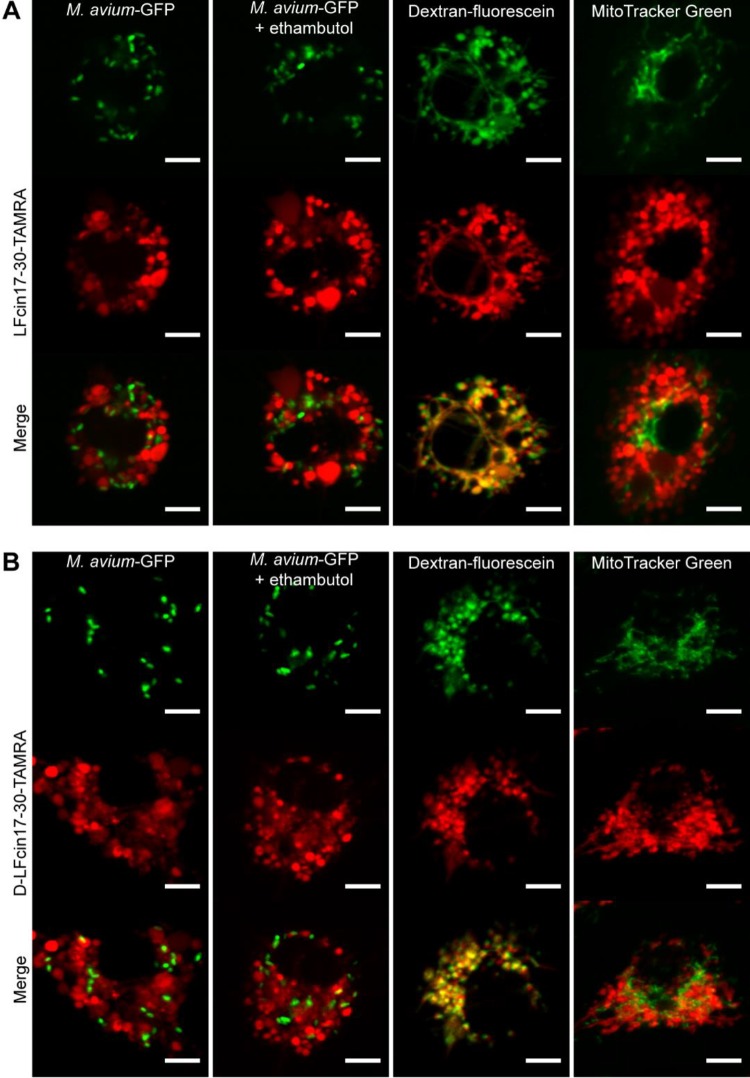
FIG 2 .
Intracellular distribution and localization of lactoferricin peptides in M. avium-infected macrophages. The figure shows live-cell imaging of BALB/c BMM infected with M. avium and treated with 10 µM red fluorescent peptide for 2 h: LFcin17–30—TAMRA (A) or d-LFcin17–30—TAMRA (B). First column, M. avium-GFP-infected macrophages; second column, M. avium-GFP-infected macrophages treated with 7.2 µM ethambutol for 2 h; third column, M. avium 2447 SmT-infected macrophages incubated with 22.5 µM fluorescein-conjugated dextran for 2 h; forth column, M. avium 2447 SmT-infected macrophages incubated with 200 nM MitoTracker Green for 30 min. One representative cell of one representative experiment out of three is shown for each condition. Scale bar, 5 µm.

