
Fig. 3.
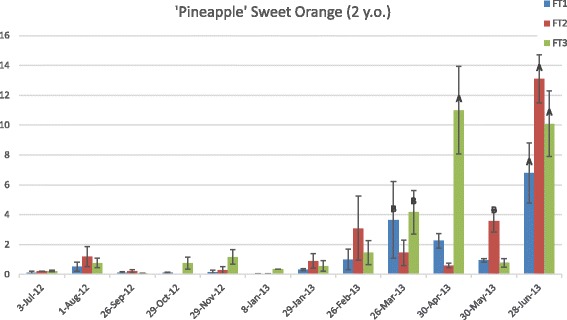
Expression of CiFT1, CiFT2, and CiFT3 in leaves of young ‘Pineapple’ sweet orange trees. Gene expression in 2-year-old trees was quantified throughout a 12-month period by real-time PCR and evaluated using the comparative CT analysis. The vertical axis indicates the relative quantitation (RQ) of gene expression levels after each sample is compared to a reference sample from 3-Jul-12. The horizontal axis displays the collection dates. Data are means ±SE (n = 3). Levels A and B of the Student’s t analysis are indicated. Columns with different letters are significantly different