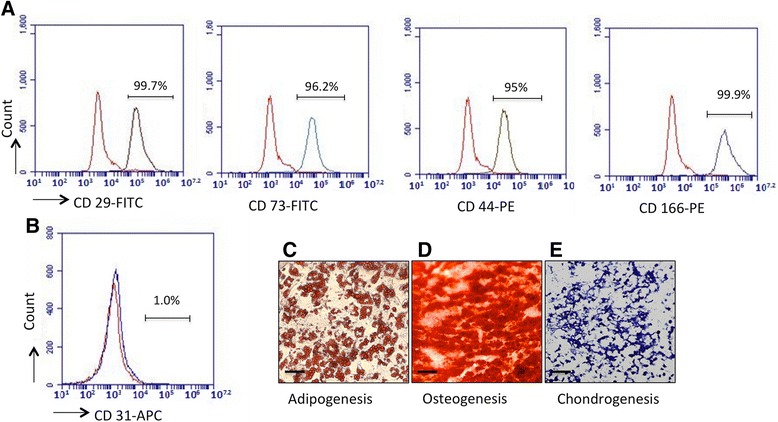
Fig. 1.

Characterization of CP-ASCs. Expression of (a) CD29, CD73, CD44, and CD166 and (b) CD31 in CP-ASCs measured by flow cytometry. Red lines, cells stained with corresponding isotype controls; gray lines, cells stained with individual antibody. Micrographs of (c) CP-ASC-derived adipocytes (oil red staining), (d) osteocytes (Alizarin red staining), and (e) chondrocytes (Toluidine blue staining). Scale bar =100 μm. PE phycoerythrin (Color figure online). FITC Fluorescein isothiocyanate, APC Allophycocyanin
