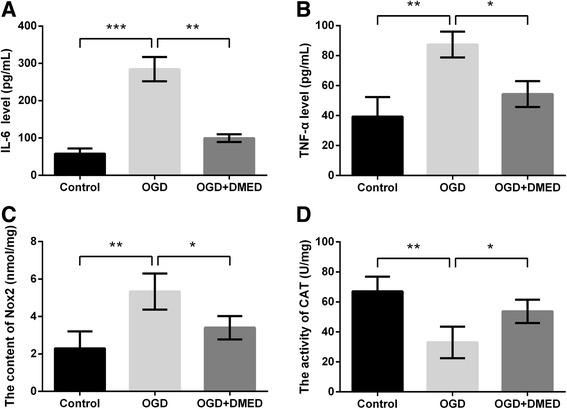
Fig. 6.

Effects of dexmedetomidine (DMED) on primary neuronal cells treated with oxygen-glucose deprivation (OGD). a The level of interleukin (IL)-6. b The level of tumor necrosis factor-α (TNF-α). c The level of NADPH oxidase 2 (Nox2). d The level of catalase (CAT). Data are presented as the mean ± SD. * p values <0.05; ** p values <0.01; *** p values <0.001
