
Figure 2.
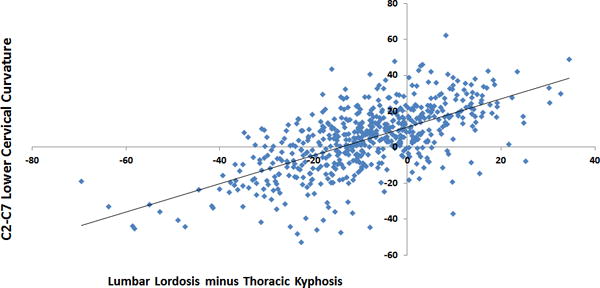
Comparison of lower cervical sagittal curve (C2-C7) in SRS-Schwab SVA groups in every group of Thoracic Kyphosis. Negative values denote cervical kyphosis. P=0.001 for all comparisons.
Official websites use .gov
A
.gov website belongs to an official
government organization in the United States.
Secure .gov websites use HTTPS
A lock (
) or https:// means you've safely
connected to the .gov website. Share sensitive
information only on official, secure websites.
Comparison of lower cervical sagittal curve (C2-C7) in SRS-Schwab SVA groups in every group of Thoracic Kyphosis. Negative values denote cervical kyphosis. P=0.001 for all comparisons.