
Figure 2.
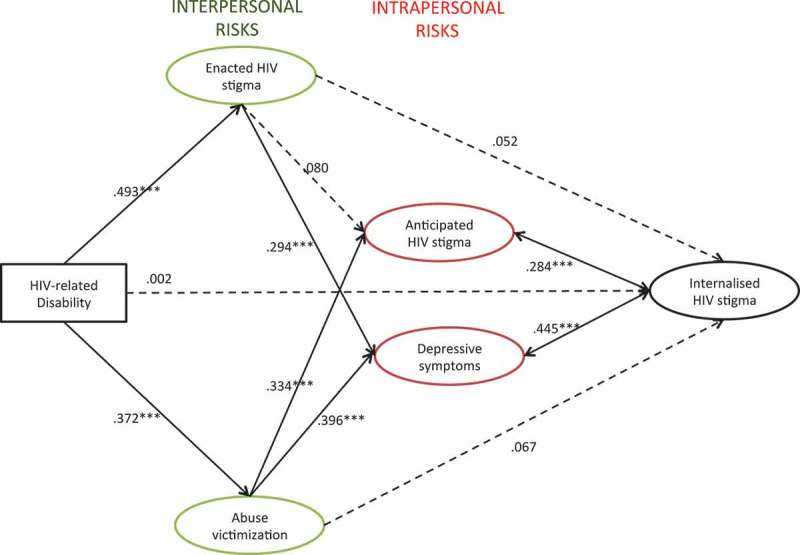
Final structural equation model results. Rectangular shape signifies an observed variable whereas ovals mark latent variables. Values indicate standardized β weights. Dotted lines indicate hypothesized pathways that were non-significant. Full lines indicate pathways that were significant. *** indicates p < .001; ** indicates p < .005; * indicates p < .05. Model fit: RMSEA: .023; CFI: .94; TLI: .95; WRMR: 1.070. Model controlled for age, gender, rural household location.