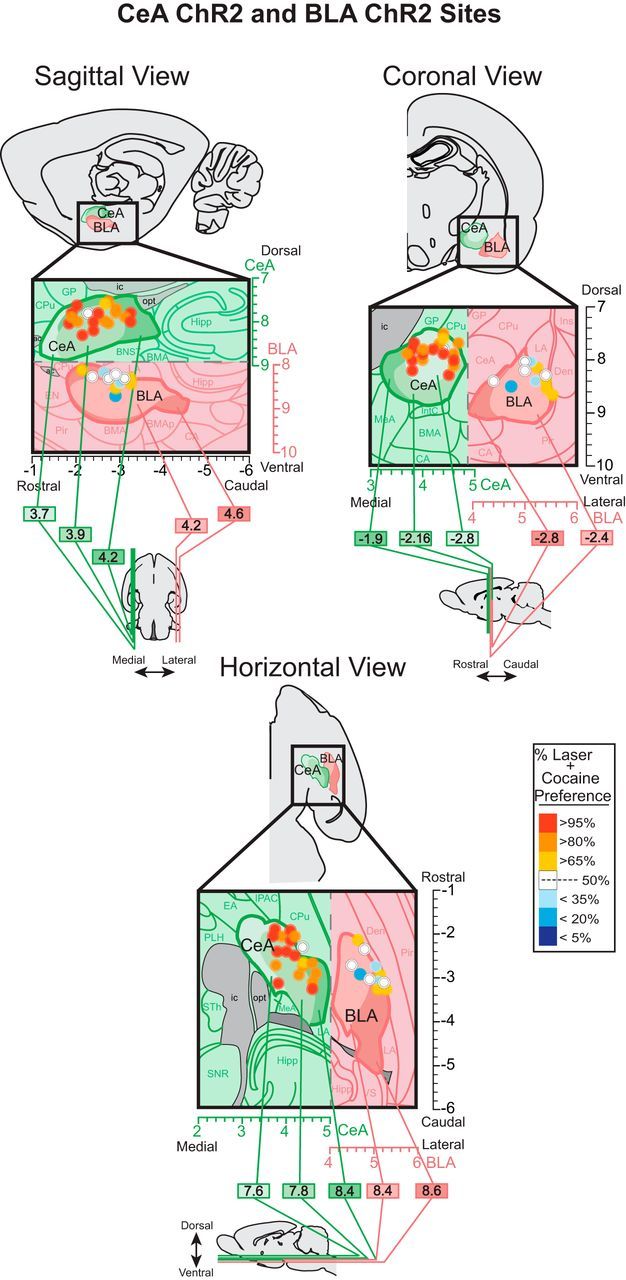
Figure 3.

Localization of function maps. Maps show behavioral effects in the two-choice task of corresponding amygdala sites in Figure 2. At each sagittal, coronal, and horizontal view, the outermost boundaries of CeA and BLA are shown at varying medial/lateral levels (sagittal view; ML 3.7 to 4.6 mm from bregma), rostral/caudal levels (coronal view; AP −1.9 to −2.8 mm from bregma), or dorsal/ventral levels (horizontal view; DV −7.6 to −8.6 mm from bregma). The unique boundaries at each level within CeA or BLA are shown as lighter to darker shades (shades of green for CeA and shades of pink for BLA). CeA but not BLA sites of fiber optics enhanced preference for cocaine. Colors depict the preference intensity for laser + cocaine caused by ChR2 laser pairing at that site, expressed as percentage of choice over cocaine alone during the last two sessions of the two-choice test. Sizes of symbols represent the average Fos plume diameter observed in CeA ChR2 and BLA ChR2 after laser stimulation (inner plumes scaled to represent Fos plume elevations >200% above control virus baseline Fos levels 0.2 mm radius; and outer plumes represent Fos plume elevations >150% above baseline Fos levels ∼0.3 mm radius).
