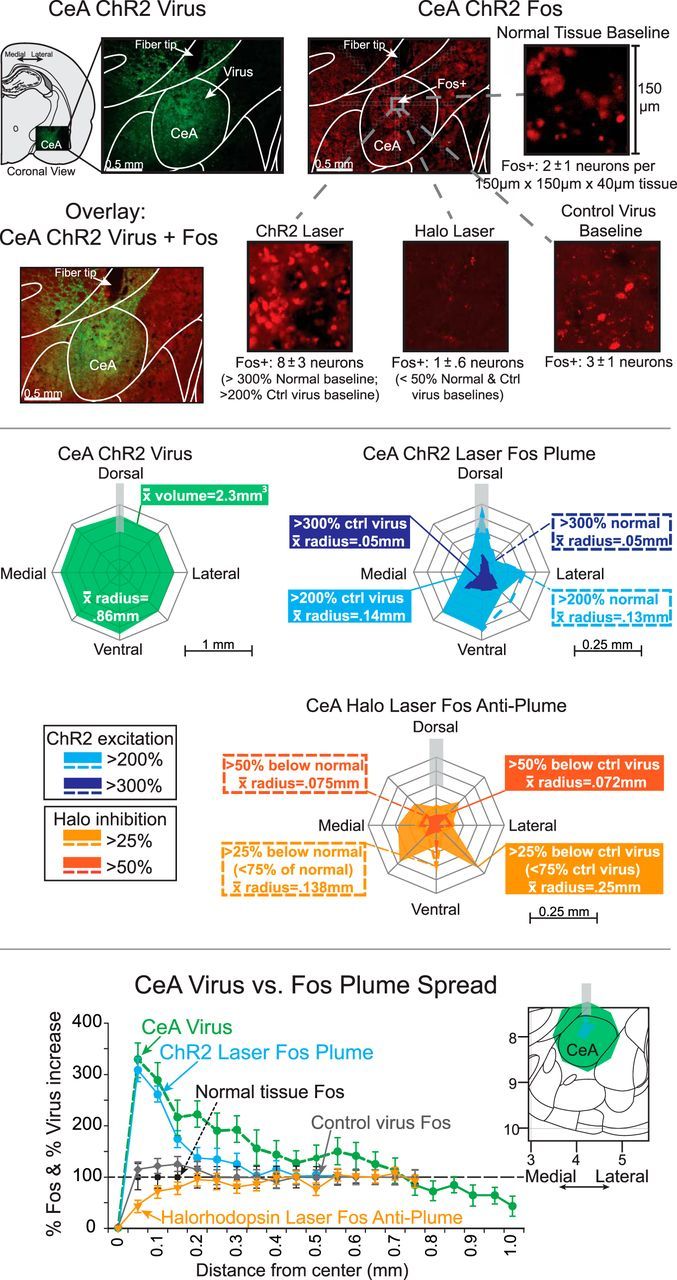
Figure 4.

Anatomical spread of laser-induced CeA Fos plumes and of virus expression. Top, Photomicrographs of CeA show green ChR2 virus expression (CeA ChR2 virus), red Fos protein immunohistochemistry expression stimulated around an fiber-optic tip, induced by laser illumination in a CeA ChR2 rat before euthanasia (CeA ChR2 laser Fos), and overlay photo combining GFP virus infection plus laser-induced Fos plume in the same CeA ChR2 rat (overlay: CeA ChR2 virus + Fos). Magnifications of 150 μm × 150 μm × 40 μm CeA tissue from immediately below the fiber-optic tip depict sample numbers of Fos-expressing neurons in each condition, which were used to help determine the percentage Fos intensity within local plumes induced by laser stimulation. Groups include normal tissue baseline (spontaneous Fos in CeA of a normal unoperated rat), control virus baseline (a control rat with inactive virus in CeA, after local blue laser illumination), CeA ChR2 laser Fos plume (a CeA ChR2 rat after blue laser illumination), and CeA halorhodopsin laser (a CeA halorhodopsin rat after yellow laser illumination). For each magnification, the mean number ± SE of Fos+ neurons per 150 μm × 150 μm × 40 μm tissue sample for that entire condition's group at same anatomical position within CeA plume (relative to fiber tip) is also shown. These numbers were used to calculate the percentage change in local Fos expression at various positions within Fos plume and to establish the borders of laser-induced Fos plumes). Middle, Map on left (CeA ChR2 Virus) shows average mean radius of ChR2 virus spread in CeA from center of infection (virus radius = 0.86 mm, spherical volume = 2.63 mm3). Blue map on right shows laser-induced CeA ChR2 Fos plume (light blue outer zone is the extent of >200% Fos elevation induced by laser illumination (measured relative to baseline levels in control inactive virus rats after similar CeA laser; ∼0.14 mm mean radius). Dark blue inner zone is the extent of higher >300% Fos elevation over inactive virus levels. Note that Fos plumes may extend maximally straight below fiber-optic tip, reflecting downward path of light beam (0.35 mm). Dotted blue lines indicate similar ChR2 elevations relative to normal CeA tissue baselines (illumination of control virus may induce mild Fos elevation over normal tissue levels, perhaps due to heat, virus infection, or surgical penetration). Yellow map below shows Fos suppression caused by yellow laser illumination in CeA halorhodopsin rats (i.e., anti-plume). Outer solid orange plume is the extent of >25% Fos suppression (i.e., Fos reduction to <75% control level) compared with control inactive virus condition after yellow laser (0.25 mm mean radius). Inner solid dark orange plume shows zones of more intense >50% Fos suppression over inactive virus levels (0.072 mm mean radius). Dotted lines depict zones of suppression compared with normal baseline tissue. Bottom, Quantitative comparison of virus infection versus Fos elevation intensity as a function of distance beneath center of fiber-optic tip. Fos is plotted as percentage change from normal tissue Fos baseline (100%) (CeA ChR2 laser Fos plume: blue circles and solid blue lines; halorhodopsin laser Fos: orange downward triangles and solid orange lines; control virus Fos: solid gray diamonds). ChR2 GFP virus intensity is plotted as a percentage change from uninjected tissue (baseline = 0 + 1; CeA virus: green circles with green dashed line). All data are shown as mean ± SEM. Note that Fos elevation falls from peak levels more rapidly with distance than ChR2 virus infection, perhaps reflecting thresholds of light intensity needed to induce Fos in infected neurons.
