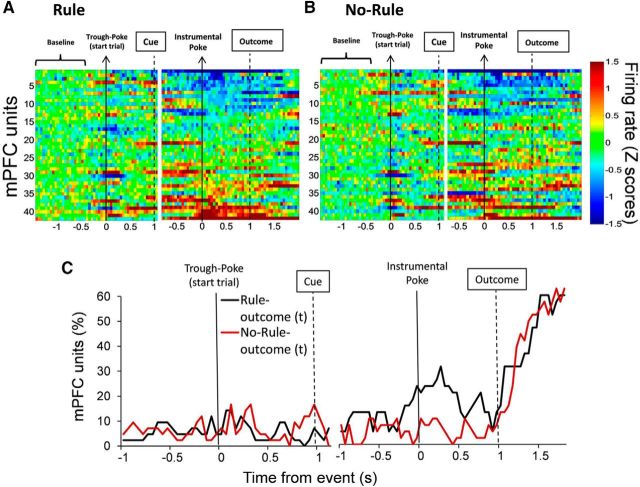
Figure 3.
PFC single-unit firing rate is modulated by outcome conditions. A, B, Heat plots represent the baseline-normalized firing rate for each unit (n = 42) during the two outcome conditions, Rule (A) and No-Rule (B). Each row is the activity of an individual unit in 50 ms time bins aligned to corresponding task events and sorted from lowest to highest average normalized firing rate. C, Time course showing the proportion of PFC units whose activity was significantly related to current (t) trial outcomes comparing Rule and No-Rule conditions. There were considerably more units anticipating the current trial outcome during the Rule compared with the No-Rule condition (χ(1)2 = 5.12; p < 0.025, average across time bins from 0 to 0.5 s).

