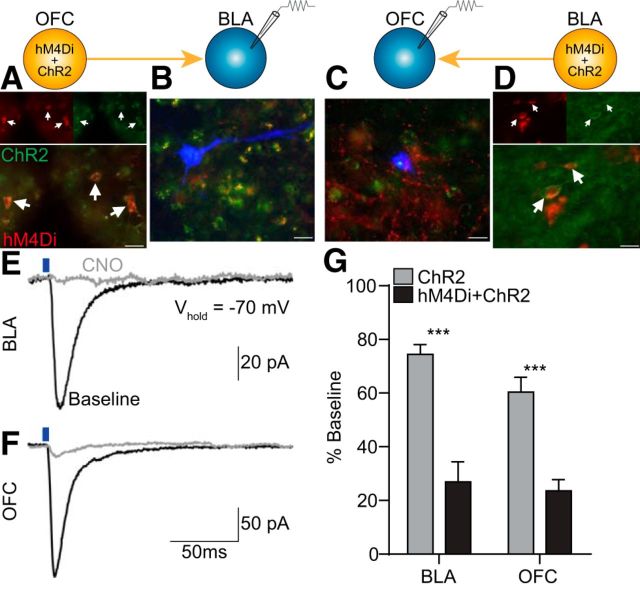
Figure 1.
Effect of CNO-hM4Di inactivation of OFC→BLA or BLA→OFC projections on postsynaptic responses. hM4Di-mCherry and/or ChR2-EYFP were expressed in either the BLA or OFC, and whole-cell patch-clamp recordings in voltage-clamp mode were obtained from postsynaptic BLA (OFChM4Di/ChR2→BLA: n = 5 cells; OFCChR2→BLA: n = 5) or OFC cells (BLAhM4Di/ChR2→OFC: n = 7; BLAChR2→OFC: n = 5) before and after CNO application. A, Representative fluorescent image of hM4Di-mCherry/ChR2-eYFP expression in OFC cell bodies. Arrows indicate coexpressing cells. B, Representative florescent image of biocytin-filled cell (blue) surrounded by ChR2-eYFP and hM4Di-mCherry terminals in BLA. C, Representative fluorescent image of biocytin-filled cell surrounded by ChR2-eYFP and hM4Di-mCherry terminals in OFC. D, Representative fluorescent image of hM4Di-mCherry/ChR2-eYFP expression in BLA cell bodies. Scale bars, 20 μm. E, Sample traces (average of 2–3 sweeps) of evoked EPSCs in BLA in response to optical stimulation of OFC terminals (blue line, 470 nm, 5 ms pulse, 8 mW) before (black) and after (gray) CNO application. F, Sample traces of evoked EPSCs in OFC in response to optical stimulation of BLA terminals. G, Average optically evoked EPSC response following CNO, expressed as a percentage of pre-CNO baseline responses, compared between subjects expressing hM4Di and ChR2 with ChR2-only controls for recordings made in the BLA or OFC. Error bars indicate SEM. ***p < 0.001.

