
Figure 9.
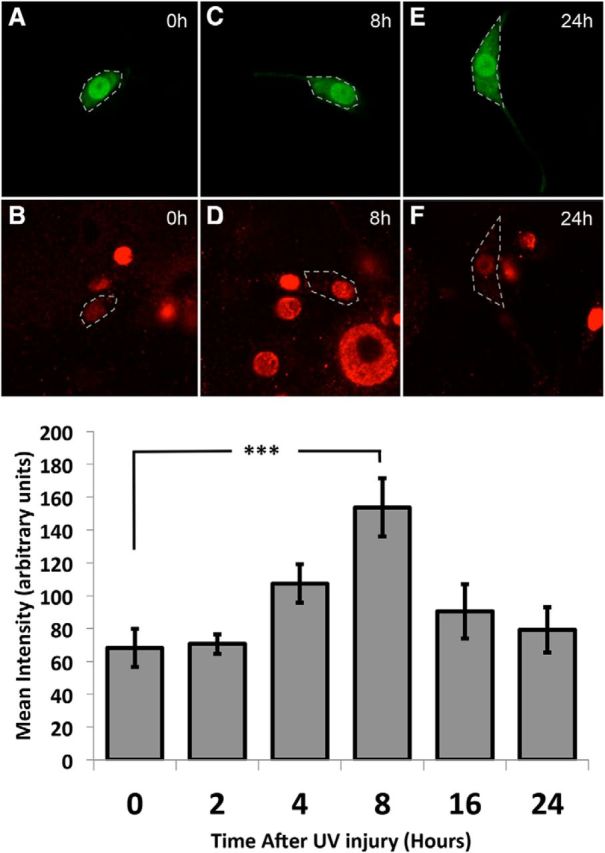
Mad phosphorylation in nociceptive neurons increases after injury. GFP expression indicates nociceptive neurons (green; A,C,E) and anti-phospho-Mad immunoreactivity (red; B,D,F). Cell bodies of the nociceptive neurons are shown outlined in white. A, B, Representative images of staining immediately following UV injury. C, D, Representative images of staining 8 h after UV injury. E, F, Representative images of staining 24 h following UV injury, at the time of peak allodynia. G, Average calculated mean intensities of phospho-Mad signaling in the nuclei of the nociceptive neurons at 2, 4, 8, 16, and 24 h after injury. n > 9 for each group. Significant increase in anti-phospho-Mad immunofluorescence detected at 8 h: ***p < 0.001 (one-way ANOVA and Tukey–Kramer Multiple Comparisons Test).