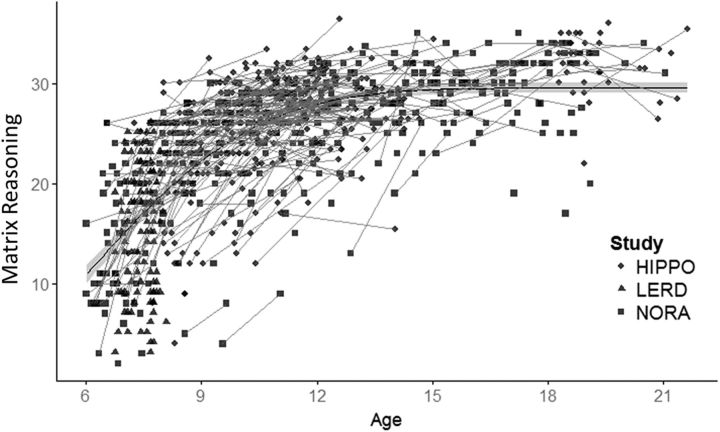
Figure 3.
Scatter plot of the relationship between age and matrix reasoning. Gray lines indicate longitudinal data. The fit line was calculated using the cumulative distribution function (pnorm in R). Optimal parameters μ = 6 and σ = 3.5, extracted from the data, indicate maximal change at age 6 (i.e., at the beginning of the examined age range).

