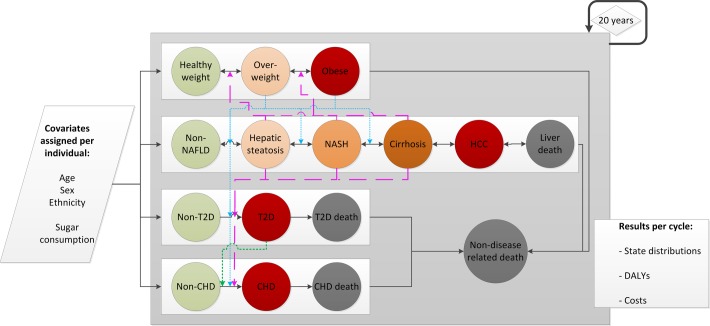
Figure 1.
Model state and covariate structure. Each individual gets assigned a state in each chain at the start of the simulation and their specific covariates (age, sex, ethnicity, high/low sugar consumption). Circles represent disease states. Solid lines indicate a possible transition pathway between states. Coloured lines indicate how being in a state within one chain can affect the value of the transition probability between two states in another chain. These are split into three categories: pink striped lines indicate the effect of NAFLD on progression in the BMI, T2D and CHD chains. Blue dotted lines indicate the effect of overweight and obesity on progression in the NAFLD, T2D and CHD chains. The green dotted line indicates the effect of T2D on progression in the CHD chain. Three chains contain disease-related deaths, and the model contains a non-disease-related death state for other causes of mortality. The states of individuals are updated every cycle (ie, annually) for 20 years. Each cycle, the state distributions and their related costs and DALYs are generated as output. CHD, coronary heart disease; DALY, disability-adjusted life year; HCC, hepatocellular carcinoma; NAFLD, non-alcoholic fatty liver disease; NASH, non-alcoholic steatohepatitis; T2D, type 2 diabetes.

