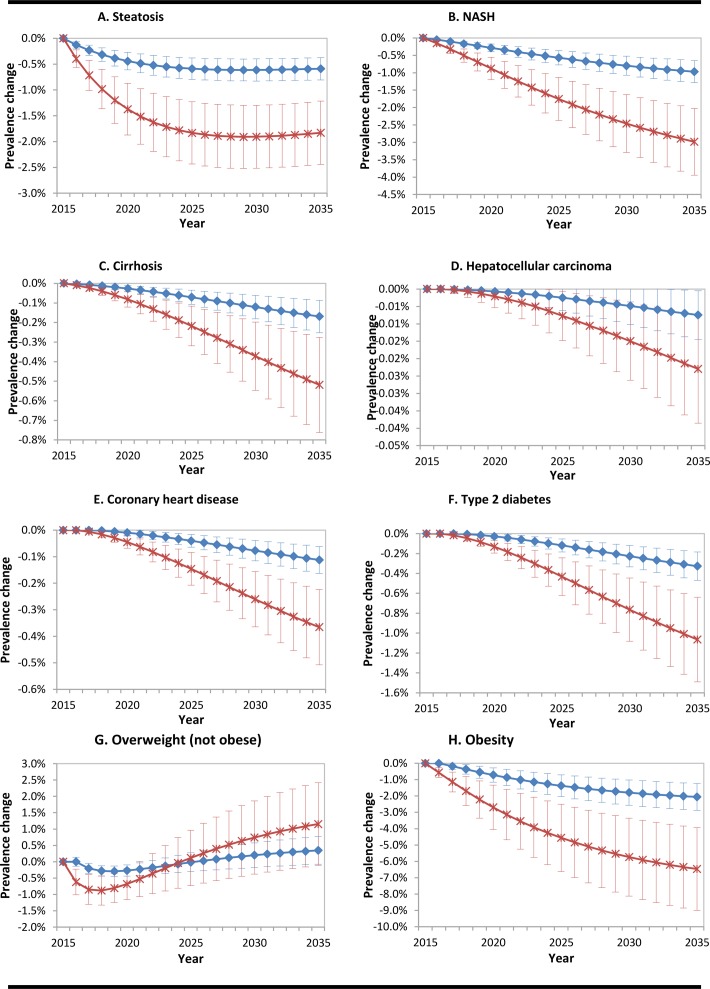
Figure 2.
Graphs A–H. Reduction in population prevalence of disease due to interventions. Lines represent mean values±1 SD; 0% is the baseline, representing no intervention. The blue lines with diamonds indicate a reduction of added sugar of 20%. The red lines with crosses represent a reduction of 50%. NASH; non-alcoholic steatohepatitis.

