. 2017 Aug 15;6:e27960. doi: 10.7554/eLife.27960

Figure 3. The fusome is required for synchronized all-or-none SG death within a cyst.

(A) A Lysotracker-positive 16-SG cyst (green, dotted outline) in unfixed control testes, with cyst borders marked by FM4–64 (red) and SG nuclei marked by Hoechst 33342 (blue). Bar: 7.5 µm. (B) Number of Lysotracker-positive cells within each 16-SG cyst of control testes at varying radiation doses. Black line, mean. n = number of 16-SG cysts scored. (C) A 16-SG cyst (dotted outline) in nos-gal4 >UAS-α-spectrinRNAi testes containing a single Lysotracker-positive SG (arrowhead). Bar: 10 μm. (D) Number of Lysotracker-positive cells within each 16-SG cyst of nos-gal4 >UAS-α-spectrinRNAi testes at varying radiation doses. Black line, mean. n = number of 16-SG cysts scored. P-values (comparing the corresponding radiation doses between control and mutant) determined by chi-squared test (See methods). (E, F) hts01103/+ control testes. Bar: 5 μm. (G, H) hts01103/Df(2R)BSC26 mutant testes. Bar: 7.5 μm.

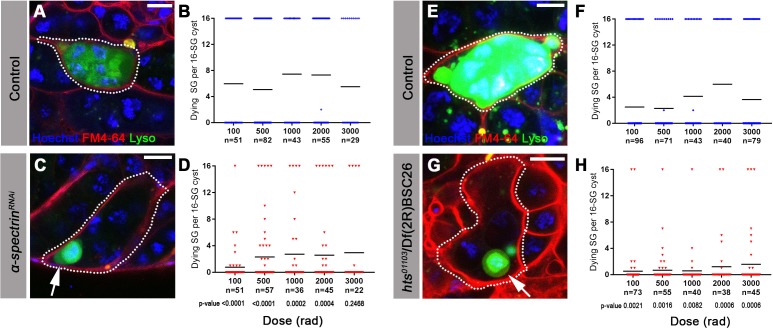
Figure 3.

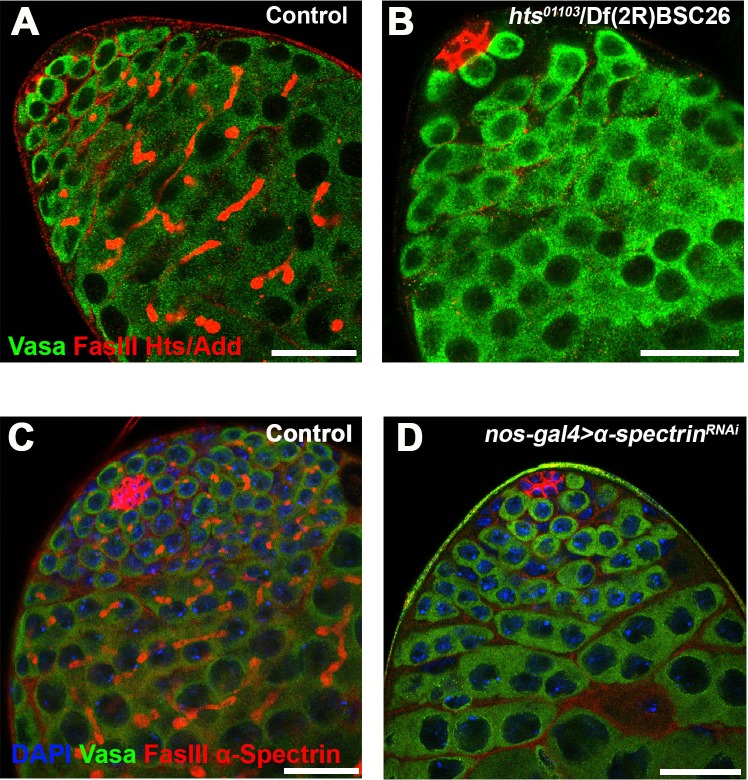
Figure 3—figure supplement 1. Validation of fusome elimination in hts mutant and α-spectrinRNAi testes.

Figure 3—figure supplement 1.

(A, B) Hts/Adducin staining (red) in control (A) and hts01103/Df(2R)BSC26 mutant (B) testes. Red: Hts/Add and FasIII. Green: Vasa (germ cells). Bars: 25 µm. Note that hts mutation eliminates fusome staining (leaving FasIII staining of the hub cells). (C, D) α-Spectrin staining (red) in control (C) and nos-gal4 >UAS spectrinRNAi (D) testes. α-Spectrin and FasIII (red), Vasas (green), DAPI (blue).
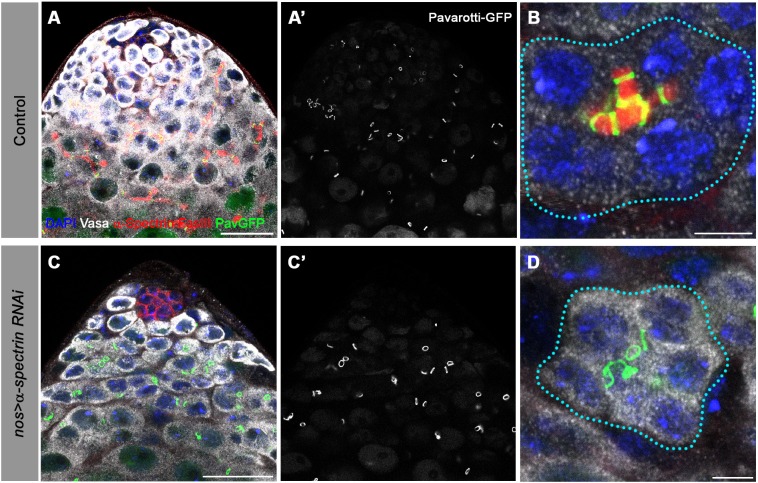
Figure 3—figure supplement 2. SG ring canals are maintained in fusome mutants.

Figure 3—figure supplement 2.

Apical tip of testes from (A) control and (C) nos-gal4 >UAS spectrinRNAi flies stained for DAPI (blue), Vasa (white), FasIII and α-Spectrin (red), and Pavarotti-GFP (green). Bars: 25 μm. SG cysts from (B) control and (D) nos-gal4 >UAS spectrinRNAi flies. Bars: 5 μm.
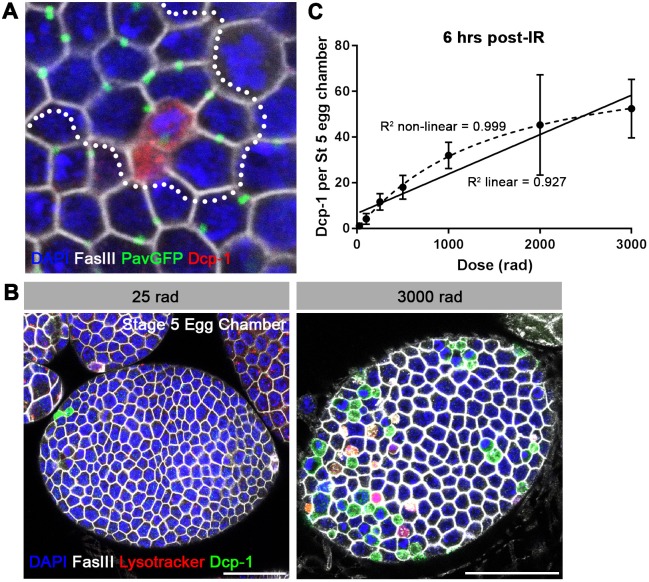
Figure 3—figure supplement 3. Follicle cell death in response to irradiation.

Figure 3—figure supplement 3.

(A) Dcp-1 staining (red) in interconnected ‘clone’ of follicle cells (dotted outline). The boundary of follicle cell clone was determined by following the connectivity visualized by Pavarotti-GFP (green) (McLean and Cooley, 2013a). DAPI (blue), FasIII (white). Bar: 5 μm. (B) Cleaved caspase Dcp-1 staining (green) in stage 5 egg chambers at 6 hr following low or high dose radiation. Lysotracker (red), DAPI (blue), FasIII (white). Bars: 25 μm. Note that follicle cells die via apoptosis, exhibiting cleaved caspase signal. Lysotoracker did not overlap with cleaved caspase, and was not distributed evenly in the cytoplasm as is the case for germ cell death. Thus, lysotracker signal in follicle cells might represent phagocytosis to engulf dead follicle cells. (C) Number of Dcp-1-positive follicle cells in stage 5 egg chambers 6 hr post-irradiation as a function of radiation dose (Mean ±SD). n ≥ 6 egg chambers, repeated in triplicate. Although the data fits to a non-linear model (R2 == 0.999) slightly better than a linear model (R2 = 0.927), follicle cell death does not exhibit steep increase in cell death at low doses (≤100 rad).