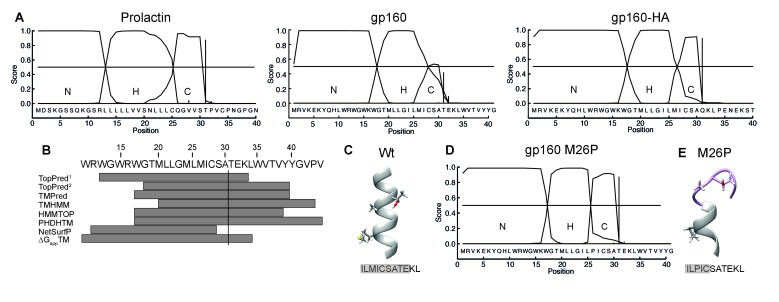
Figure 6. The C region of the gp160 signal peptide overlaps with the hydrophobic core region.
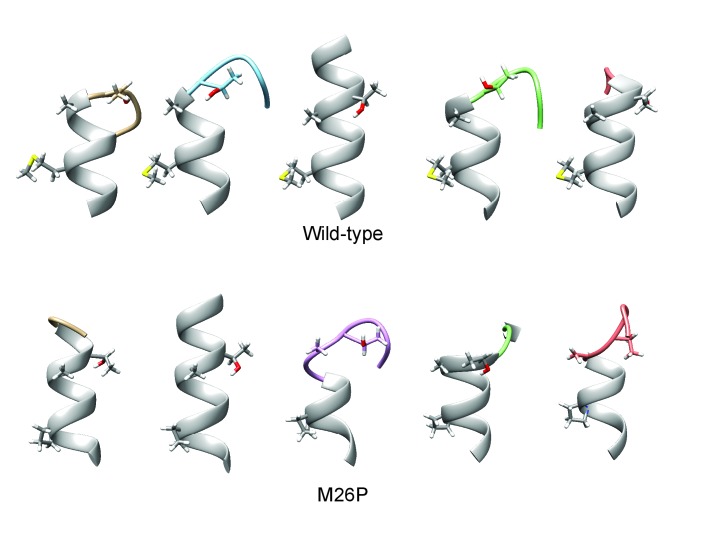
(A) Signal-peptide prediction tool SignalP 3.0 (36) was used to assess signal peptides of prolactin, gp160, and gp160 signal peptide followed by HA (as used in Figure 1B). The characteristic N-terminal charged region (N), the hydrophobic membrane-spanning region (H), and the C-terminal region (C) containing the cleavage site were plotted. Vertical bars represent the first amino acid after the cleavage site. (B) TopPred1 (Goldman, Engelman, and Steitz scale), TopPred2 (Kyte and Doolittle scale), TMPred, TMHMM, HMMTOP, PHDHTM, and NetSurf Helix were used to predict the transmembrane domain of the gp160 signal peptide. The predicted transmembrane domains are represented by grey bars below the HXB2 sequence (residues 12–45). The cleavage site is marked by a vertical line. (C) Robetta (Kim et al., 2004) was used to predict the structure of the area around the signal-peptide cleavage site of wild-type gp160. Residues M26, A30 and T31 are shown as sticks. Alpha helices colored in grey. (D) SignalP prediction of gp160 M26P signal peptide. (E) as in (C) except M26P gp160 was used for the prediction. Structures shown are representative of the 5 predicted structures received from the Robetta server.


