
Figure 2. TC-PD at low power, with variable proportions of tubulocystic and poorly differentiated components.
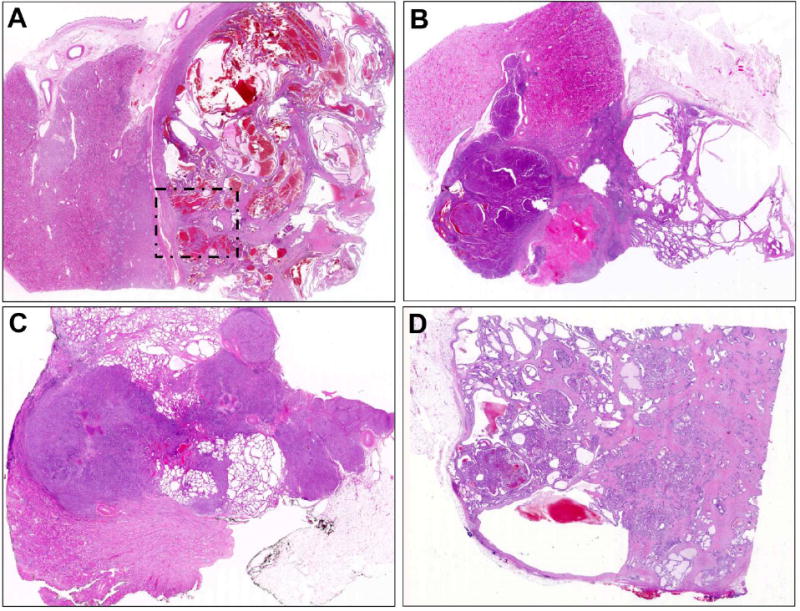
A. Case TC-PD 18 demonstrates predominantly well circumscribed tubulocystic morphology, in this case ∼90% over all sections reviewed, with only focal dedifferentiation apparent in the area indicated (detailed Figure 7B-D). B. TC-PD 29 demonstrated ∼50% tubulocystic pattern (right) with ∼50% solid and dense tubular growth across all sections reviewed. C. TC-PD 27 demonstrated overall ∼30% tubulocystic morphology, seen here above and below the predominant pattern of collecting duct carcinoma-like infiltrative glandular growth with desmoplasia. D. Case TC-PD 16 demonstrated only focal (∼10%) tubulocystic morphology (apparent upper left and Figure 3A) with predominant poorly differentiated patterns of infiltrative glands with desmoplasia, solid/nested, and cribriform growth.