
Figure 2. Hunger gates InsCtx responses to learned visual cues.
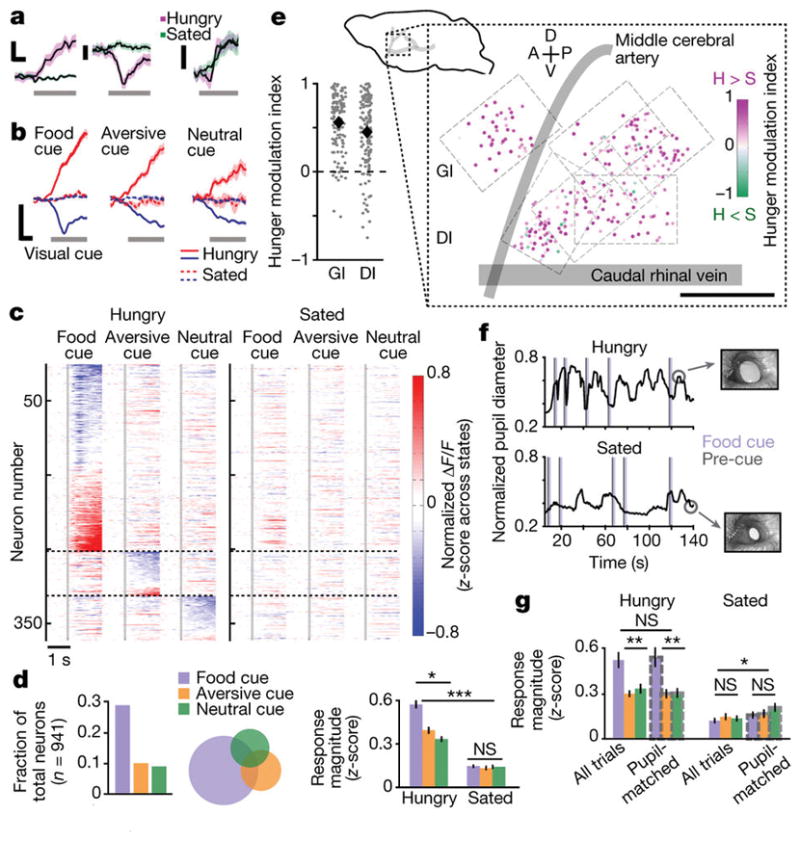
a, Example single-neuron food cue responses during hunger and satiety. Scale bars, 0.5 s and normalized ΔF/F (fractional change in fluorescence, z-scored across states; left: 0.2; others: 0.1). b, Average population cue responses during hunger and satiety. Scale bars, 0.5 s and 0.3 normalized ΔF/F. Mean ± s.e.m.; n = 274, 95, and 85 food, aversive, and neutral cue-responsive neurons, respectively; six mice. c, Average cue responses during hunger and satiety for cue-responsive neurons, grouped by the cue evoking the strongest response (horizontal dashed lines). Vertical dashed lines: visual cue onset. d, Fraction of cue-responsive neurons (left), response selectivity (middle), and magnitude (right); n = 941 neurons, six mice. Within-state: *P = 2.8 × 10⁻¹² (Hungry); NS, P = 0.6 (Sated); Kruskal–Wallis test. Hungry: food versus aversive cue, P = 1.7 × 10⁻⁸; food versus neutral cue, P = 7.3 × 10⁻¹¹; aversive versus neutral cue, P = 0.01. Hungry versus Sated: ***P ≤ 2.7 × 10⁻¹⁹ for all cues, Mann–Whitney U-test. Mean ± s.e.m. e, Bottom left: hunger modulation index for all food-cue-responsive neurons (dots) in granular (GI) versus dysgranular (DI) subregions of InsCtx. Diamonds, means (n = 274 neurons, six mice). Top left: side view of mouse brain. Right: spatial map of hunger modulation index across cue-responsive neurons. H, hungry; S, sated. f, Pupil diameter dynamics during the discrimination task. g, Response magnitude, all trials versus pupil-matched trials. Within-state comparisons: **P < 0.02; NS, P > 0.13; Kruskal–Wallis test. Hungry: P > 0.4 for all cues; Sated: food cue, P = 0.2 (n = 69); aversive cue, P = 0.6 (n = 39); neutral cue, P = 0.03 (n = 38); Mann–Whitney U-test (n = 3 mice).