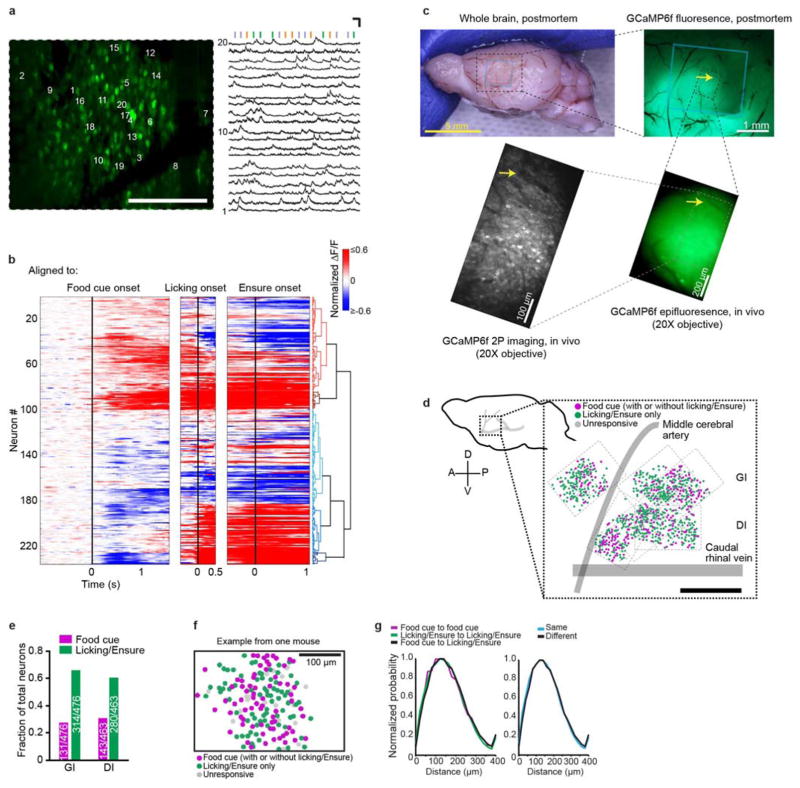
Extended Data Figure 2. InsCtx activity from an example field of view; most food-cue-responsive neurons also respond to licking/Ensure; localizing imaging fields of view relative to vasculature; no spatial organization of InsCtx food cue and licking/Ensure responses.
a, Example two-photon image (same mouse as in Fig. 1f) containing ~150 active neurons. Scale bar, 100 μm. Right: example activity of 20 neurons (labelled in the left panel) from the same field of view during the behavioural task (vertical bars: presentation of visual cues). Scale bars, 10 s and 100% (ΔF/F). Note that GCaMP dynamics reflect the high ongoing firing rates of mouse InsCtx neurons in vivo (6–10 Hz on average; ref. 10). b, Heatmaps of average responses of all food-cue-responsive neurons meeting the criteria for the clustering analysis (each row is the average activity of a single neuron). Neurons were clustered on the basis of their food cue and licking responses (see Methods). Different heatmaps were aligned to different events (food cue onset, licking onset, Ensure delivery), and all responses were computed relative to the pre-cue period. Notice that many food-cue-responsive neurons also responded to licking/Ensure. c, Post-mortem analysis of the location of the microprism and imaging field of view. Top left: side-view image of the brain of a mouse implanted with a microprism. Blue rectangle shows location of microprism imaging face, identified by a minor indentation of the brain. Top right: post-mortem epifluorescence image of GCaMP6f in lateral cortex. Blue rectangle shows microprism location. Bottom right: in vivo epifluorescence image of GCaMP6f through the microprism at the imaging field of view location. Bottom left: in vivo two-photon field of view, imaged through the microprism. The image was adjusted to enhance the visibility of the neuropil and vasculature. Arrows point to the same vascular landmark in different images. d, Left: schematic side view of the mouse brain. Right: anatomical location of all imaged neurons (dots) across mice, relative to the junction of caudal rhinal vein and middle cerebral artery. Magenta: food-cue-responsive neurons; green: licking and/or Ensure-responsive neurons; grey: unresponsive neurons; dashed rectangles: borders of each imaging field. Scale bar, 0.5 mm. e, Fraction of food-cue-responsive neurons and of licking and/or Ensure-responsive neurons in granular (GI) versus dysgranular (DI) subregions of InsCtx. f, Example field of view from one mouse. Neuron locations are marked with coloured circles (magenta: food-cue-responsive; green: licking/Ensure-responsive only; grey: unresponsive). Scale bar, 100 μm. g, Left: distribution of distances between pairs of neurons in which (1) both neurons were responsive to the food cue (magenta), (2) both neurons were responsive to licking/Ensure (green), and (3) one neuron was responsive to the food cue and the other neuron is responsive to licking/Ensure (black). Note that all three distributions are similar, suggesting no spatial clustering. Right: distribution of distances between pairs of neurons having the same type of response (that is, either both responding to the food cue or both responding to licking/Ensure, blue), and between pairs of neurons with different response types (for example, one neuron responding to the food cue and the other responding to licking/Ensure, black). Note that these distributions are similar, suggesting no spatial clustering.

