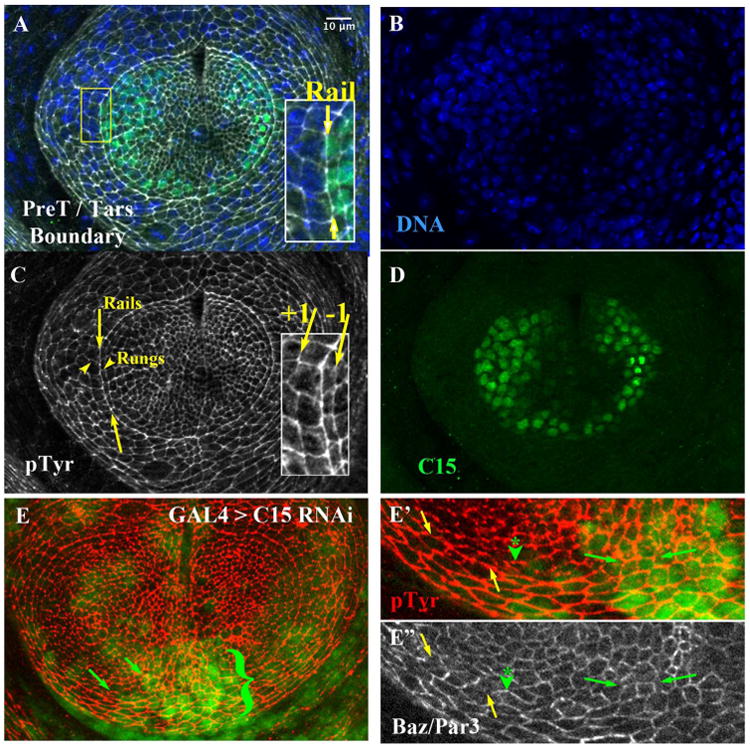
Fig. 1.

The pretarsal / tarsal aligned Arc Depends on C15. A) Late third instar leg disk triply labeled (merge in A) for B) DNA (Hoechst), C) Anti Phospho-Tyrosine (pTyr, white), and D) Anti-C15 (green). Inset in A: magnified view, where yellow arrows highlight the rail interface comprising the tarsal / pretarsal boundary. C) The area between the yellow arrows highlight a portion of rail interfaces; arrowheads highlight two rungs, located orthogonal to rail interfaces. The inset highlights interfaces made from cells one cell column to the inside of the rail (−1 interface) or one column to the outside (+1 interface). E) A small clone of cells expressing C15 RNAi, marked by nuclear GFP. Cell outlines revealed by pTyr (Red). The area adjacent to the bracket exhibited a disruption in smoothness of the rail. E′ and E″) Magnification of the lower portion of the arc. The yellow arrows first highlight a section of the rail not subject to C15 RNAi. This wild-type portion of the rail was relatively depleted for Bazooka/Par3 (E″, white, section between yellow arrows), while orthogonal rungs were enriched as expected (see forward to Fig. 2C′ and D). In contrast, in cells or regions affected by C15 RNAi (at the green arrowhead, and the section between the small green arrows) Bazooka/Par3 accumulated ectopically on horizontal interfaces, rather than being restricted to orthogonal boundaries. Scale bar applied to insets of A, C, or panel E′, E″ would be 5 μm.
