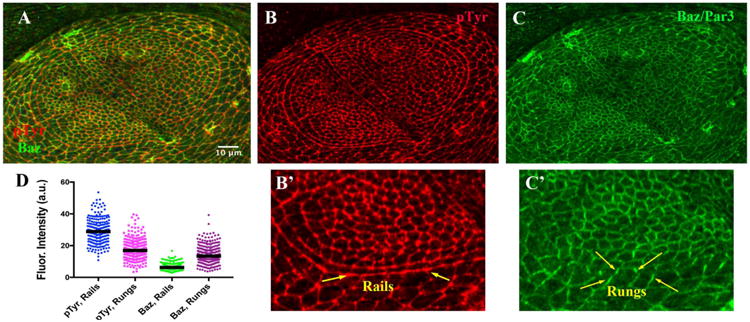
Fig. 2.

Relative Enrichments of pTyr along Rails & Baz along Rungs. A – C). Late third instar leg disk doubly labeled, merge in A, for B) Anti Phospho-Tyrosine (pTyr, Red), and C) Anti-Bazooka (Green). B′ and C′) Magnification of the lower portion of the arc, within the Posterior compartment. The area between the yellow arrows highlight the rail, enriched for pTyr, and relatively depleted for Baz, which instead was enriched on rungs, located orthogonal to rail interfaces. D) Scatter plot for fluorescence intensities (in arbitrary units), with bar representing the median value. Scale bar applied to B′, C′ would represent 5 μm.
