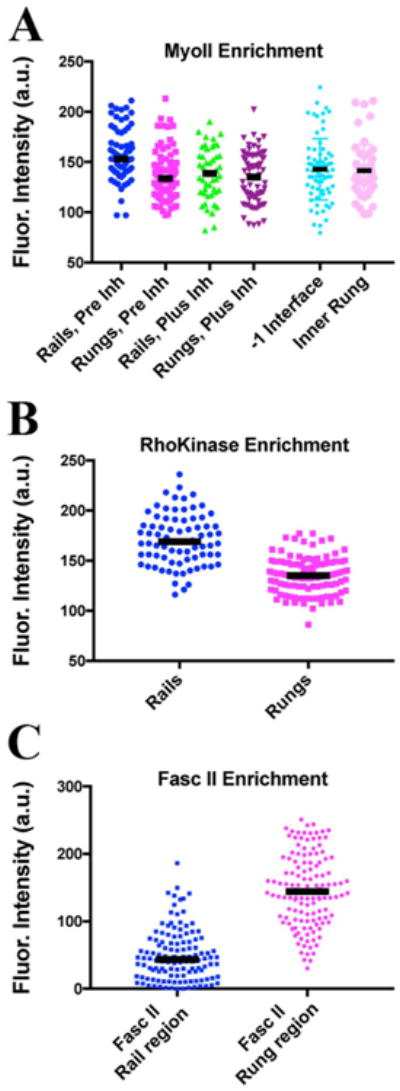
Fig. 4.

Myosin II and Rho Kinase are enriched on Rails, while Fasciclin II is enriched on orthogonal interfaces. Scatter plot for fluorescence intensities (in arbitrary units), with bar representing the median value. Data in A and B are from live imaging. A) Regulatory light chain∷mCherrry (Sqh∷mCherry) values for rail (blue dots, Pre Inh) and rungs (magenta dots, Pre Inh) before treatment of disks with a Rho Kinase inhibitor. An example RLC∷mCherry disk is shown in Fig. 6A″. The same disks about 40 min after treatment with the Rho Kinase inhibitor: rail (green dots, Plus Inh) and rungs (purple dots, Plus Inh). An example RLC∷mCherry disk after Rho K treatment is shown in Fig. 6B″. Since we noted significant alignment of the interfaces flanking the rail, we considered whether RLC-mCherry might be enriched on these flanking interfaces (before inhibitor treatment). However, there was no obvious enrichment, and quantitation confirmed observed no significant difference in RLC-mCherry comparing the −1 interface and the adjacent inner rung interfaces (light blue and light magenta dots; median fluorescence was 132 versus 146, p = 0.52; 4 disks, 52 and 74 interfaces, respectively). B) Rho Kinase∷GFP levels (RhoK{K116A} (Simões et al., 2014)) comparing rail interfaces (blue dots) and rung interfaces (magenta dots). C) Quantitation of Fasciclin II levels in fixed and stained disks. Since Fasc II accumulates just basal to the adherens junction (as defined by the domain of highest pTyr signal), Fasc II was quantified from the region just beneath the rail (blue dots) and just below the rung (magenta dots).
