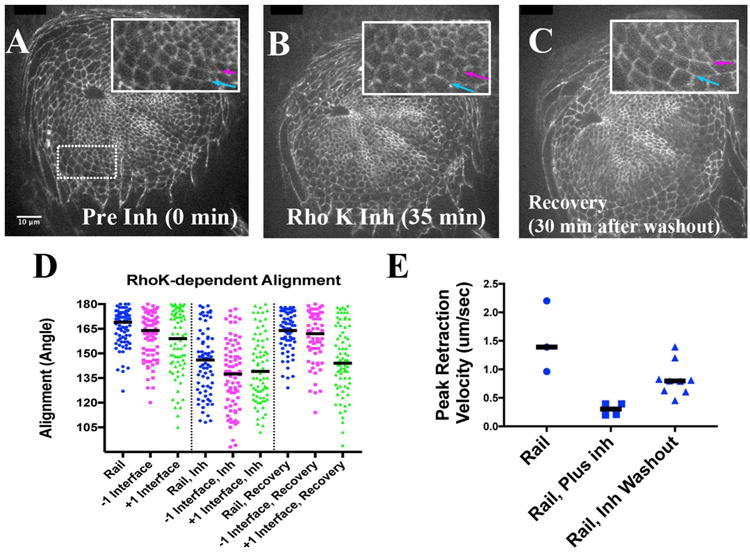
Fig. 7.

Relative Rail Alignment depends on Rho Kinase. A-C) Stills from a live imaging session. A) Before the addition of Rho Kinase inhibitor. Inset: magnified view of boxed area. Blue arrow highlights the rail, while the magenta arrow highlights the −1 interface. B) About 35 min after addition of Rho Kinase inhibitor (see Section 4.4). The blue and magenta arrows point to the same interfaces as in panel A. C) About 30 min after wash-out of the inhibitor (∼150 min relative to panel A). D) Scatter plot of alignment angles (in degrees) of rail, −1 and +1 interfaces, with a bar marking the medians. The left-hand section of plot is before addition of Rho Kinase inhibitor, the middle represents alignment in the presence of the inhibitor, and the right-hand side represents alignment after recovery (after wash-out of inhibitor). E) Scatter plot representing normalized peak reaction velocities for rail interfaces before, during and after recovery from Rho Kinase inhibitor treatments. Scale bar applied to insets would be 6 μm.
