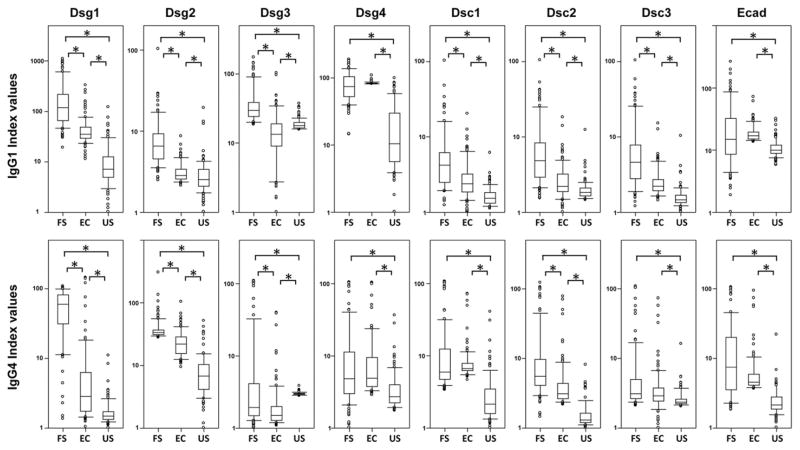
FIGURE 1. IgG1 (upper panels) and IgG4 (lower panels) anti-keratinocyte cadherin responses differ among FS patients, endemic controls, and United States controls (US).
Sera from FS patients, endemic controls (EC), and United States controls were tested for IgG1 and IgG4 reactivity to Dsg1, Dsg2, Dsg3, Dsg4, Dsc1, Dsc2, Dsc3, and E-cad by ELISA. Index values were calculated, and the results for each population are displayed as box plots. To use a logarithmic scale, we shifted index values in each plot by an amount specific to that plot to make the lowest value equal 1. Each box extends from the lower to the upper quartile (25–75%), with the median shown within the box. A significant difference between paired groups is marked by an asterisk (*).

