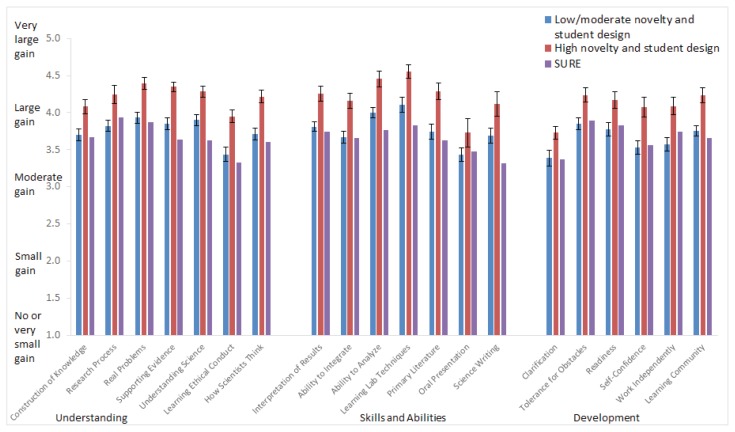
FIGURE 6.
Student self-reported benefits for “Low/moderate novelty and student design” or “High novelty and student design” courses and the National SURE results. The National SURE mean and standard deviations are for summer 2014 averages for ≤ 3,041 student responses. Means and standard errors for each item are shown. For all benefits except Oral Presentation, “High novelty and student design” courses in cluster 2 resulted in significantly higher benefits than “Low/moderate novelty and student design” courses after controlling for experimentwise-error rate with sequential Bonferroni. Numerical data are presented in Appendix 6. SURE = survey of undergraduate research experiences.

