
Fig. 2.
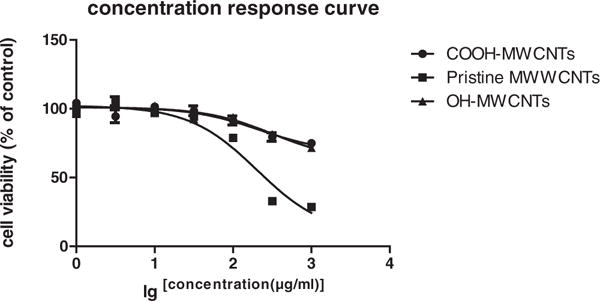
Cell viability curve of A549 cells was evaluated after 24 hour exposure to pristine MWCNTs, OH-MWCNTs and COOH-MWCNTs with concentrations from 1 to 1000 μg/ml. Viability was detected by using WST-1 assay. Data are represented as mean ± SD of triplicate. * p < 0.05, **p < 0.01.