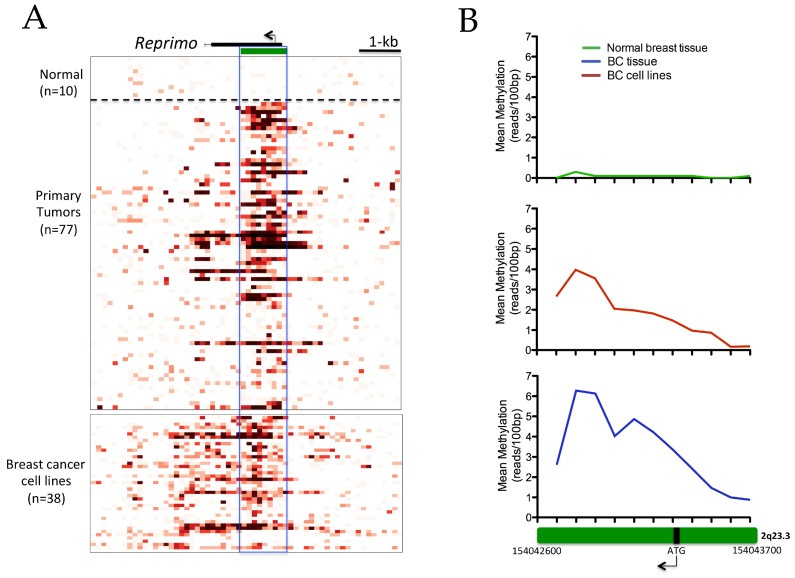
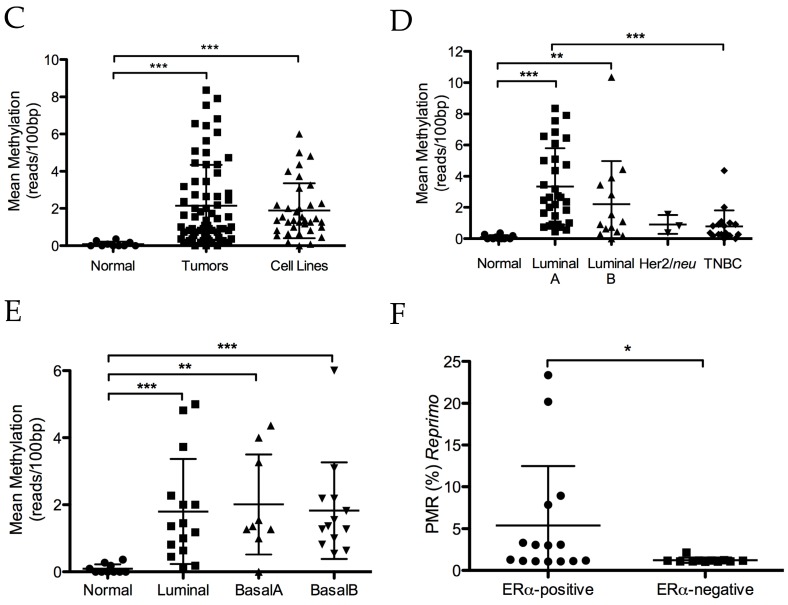
Figure 1.
DNA methylation of promoter CpG-island (CGIs) region in breast cancer. Methyl-CpG binding domain (MBD-seq) was used to generate DNA methylation profiles of normal breast tissue (n = 10), primary tumors (n = 77), and cell lines (n = 38). (A) The figure represents methylation intensity by 100-bp resolution. The pre-calculated methylation intensity is shown as a red gradient heatmap. At the top part, in black is shown the gene body with an arrow that indicates the ATG sequence. In green, the CGIs of the gene is shown. The solid line highlights the region analyzed (1.1 kb; chr2: 154042600–154043700); (B) the Green box represent CGIs amplified from Figure 1A, where we observe a higher mean methylation of CGIs for each 100-bp resolution (calculated as the mean methylation for each 100-bp) in primary tumors and cell lines respect to normal breast tissue; (C) methylation intensity (calculated as the mean methylation intensity of CGIs—1.1 kb—for each case) was significantly higher in primary tumors and cell lines compared to normal breast tissue (p < 0.0001); (D) a scatter plot among different molecular subtypes in primary tumors showed significant differences in the average value of methylation in the Reprimo (RPRM) CGIs region for Luminal A compared to normal breast tissue and also for triple negative breast cancer (TNBC); (E) a scatter plot among different molecular subtypes in breast cancer (BC) cell lines showed significant differences compared to normal breast tissue, but not among them; (F) scatter plot of the validation cohort (26 breast cancer samples) showing the significant differences in percentage-methylated relative (PMR) of RPRM CGIs between breast cancer estrogen receptor α (ERα)-positive and ERα-negative. TNBC, triple negative breast cancer. * p < 0.05; ** p < 0.001; *** p < 0.0001.


