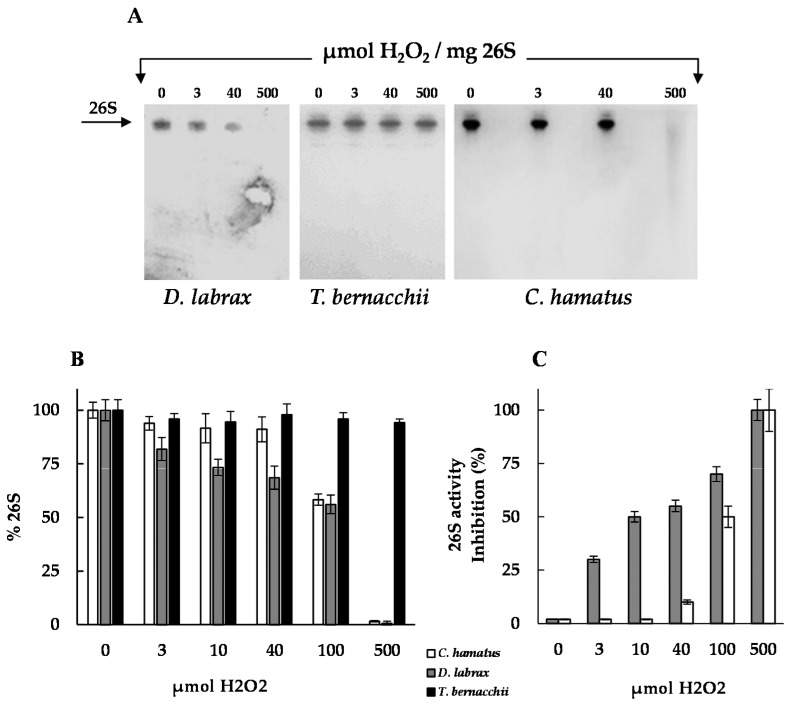
Figure 5.
Effects of H2O2 exposure on D. labrax and C. hamatus 26S proteasomes. (A) Native-PAGE analysis of 26S proteasomes, after incubation with increasing H2O2 concentrations for 24 h at 37 °C, is shown in comparison with that performed on the T. bernacchii 26S proteasome reported in Gogliettino et al. [18]. The arrow indicates the position of 26S proteasome band in each lane. The bands were visualized by Coomassie blue staining. (B) Densitometric analysis of Native-PAGE bands were performed by CHEMIDOC XRS and QUANTITY ONE software and expressed as percentage density of the 26S proteasome gel band at all the H2O2 concentrations tested. The experiments were performed in duplicate on two different protein preparations loading equal amounts of 26S proteasomes. Densitometric data are expressed as means ± standard deviations. (C) CT-like 26S proteasome activities after incubation at the indicated H2O2 concentrations for 24 h. Data were expressed as % of 26S activity inhibition.

