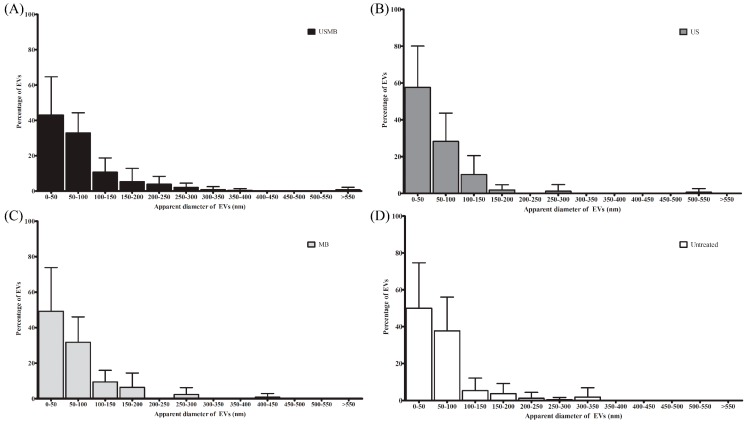
Figure 4.
Size distribution of EVs detected in conditioned media collected at 4 h from cells after microbubbles-assisted ultrasound (USMB, A), ultrasound (US, B), or microbubbles (MB, C) treatments, and from untreated cells (D). Surface area of EVs was measured using Image J [20] to calculate the apparent diameter of EV (nm). Bin size is 50 nm. EVs were detected from 10 images per grid (60,000× magnification) derived from four independent experiments. Percentage of EVs represents the percentage of mean of EVs at certain size range + standard deviation.

