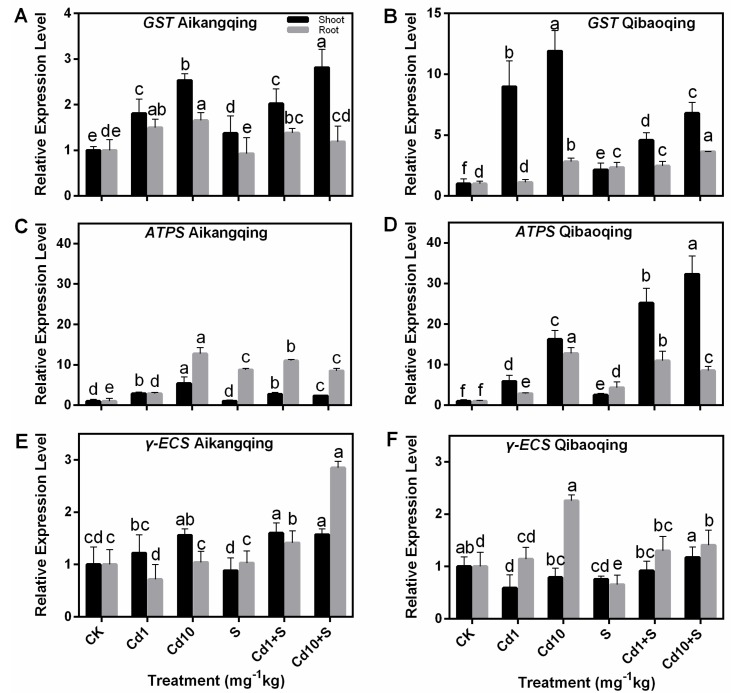
Figure 7.
Expression of key enzymes activities of S assimilation pathway and GSH metabolism. Transcripts were analyzed by qPCR using Actin gene as internal control. (A,C,E) transcript levels of GST, ATPS and γ-ECS genes in Aikangqing; (B,D,F) transcript levels of the three genes in Qibaoqing, respectively. The leaves and roots of three seedlings were collected in one replication and three independent biological replications were performed. Each value is the mean ± standard deviation of three independent measurements. Different letters indicate significant differences (p < 0.05).

